Home / Blog / App Updates
New on PantauSivik.com: History charts of Singapore traffic, crowds, lightning and alerts
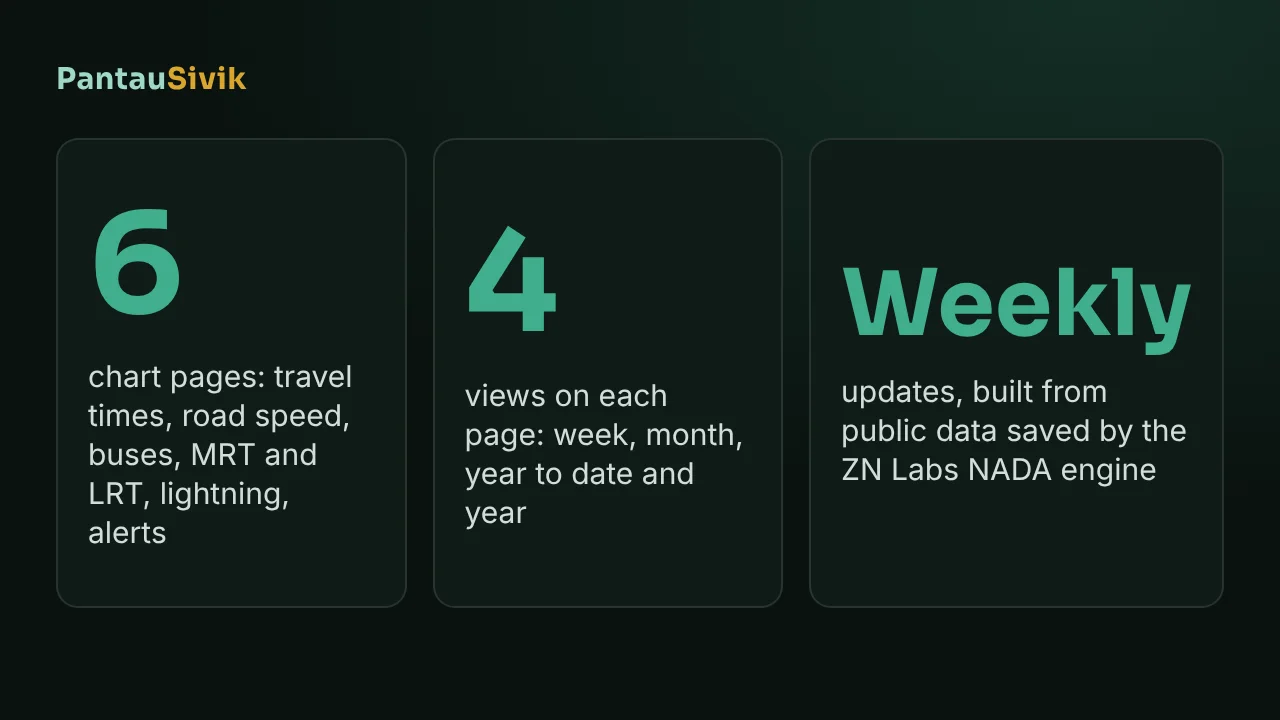
PantauSivik has been saving public data about Singapore since mid October: how long expressway trips take, how fast roads move, how full buses and MRT platforms are, how much lightning there is and which alerts we sent. Until now that history only showed up in our blog posts. Today it has its own section on the website, History, with charts you can open any time.
In short: History has six chart pages, one for each kind of data. Each one has Week, Month, Year to date and Year views, hour by hour detail and a heatmap. Month, Year to date and Year switch on once there is enough data, and they show greyed out until then. The charts update weekly, use Singapore time and are summaries of past readings, not live data.
What is in History
- Expressway travel times shows how long it takes to drive each expressway, by hour, direction and day, from the Land Transport Authority estimates.
- Road speed shows the average speed band by hour for each road category, where band 8 is the fastest and band 1 the slowest.
- Bus crowding shows how often buses at the interchanges we collect are Standing only or Crowded.
- MRT and LRT platform crowding shows the share of platform readings rated high, by line and hour.
- Lightning shows strikes per day and by hour of the day.
- Alerts shows how many alerts we sent each day, by type, for Singapore and Malaysia.
The overview page puts one chart from each category side by side, so it is the quickest way to see what is there.
How to read the charts
Every category page has the same layout. A line or bar chart at the top shows one number per day. Below it, the time of day chart shows the average for each hour, with a dotted line for the previous period so you can see whether things are getting better or worse. The heatmap shows each day as a row and each hour as a column, and darker means more.
The period buttons are Week, Month, Year to date and Year. Week uses the last 7 days, Month the last 30, and Year the last 365. Year to date runs from 1 January. Month needs 30 days of data, Year to date needs 90 and Year needs 365, so for now only Week is open and the others are greyed out with a note about when they switch on. Nothing needs to be turned on by us. They open by themselves as the history grows.
A few things the charts already show
These numbers cover 18 October to 12 November 2026, 25 complete days. They are what we saw, so they may move as more days are added.
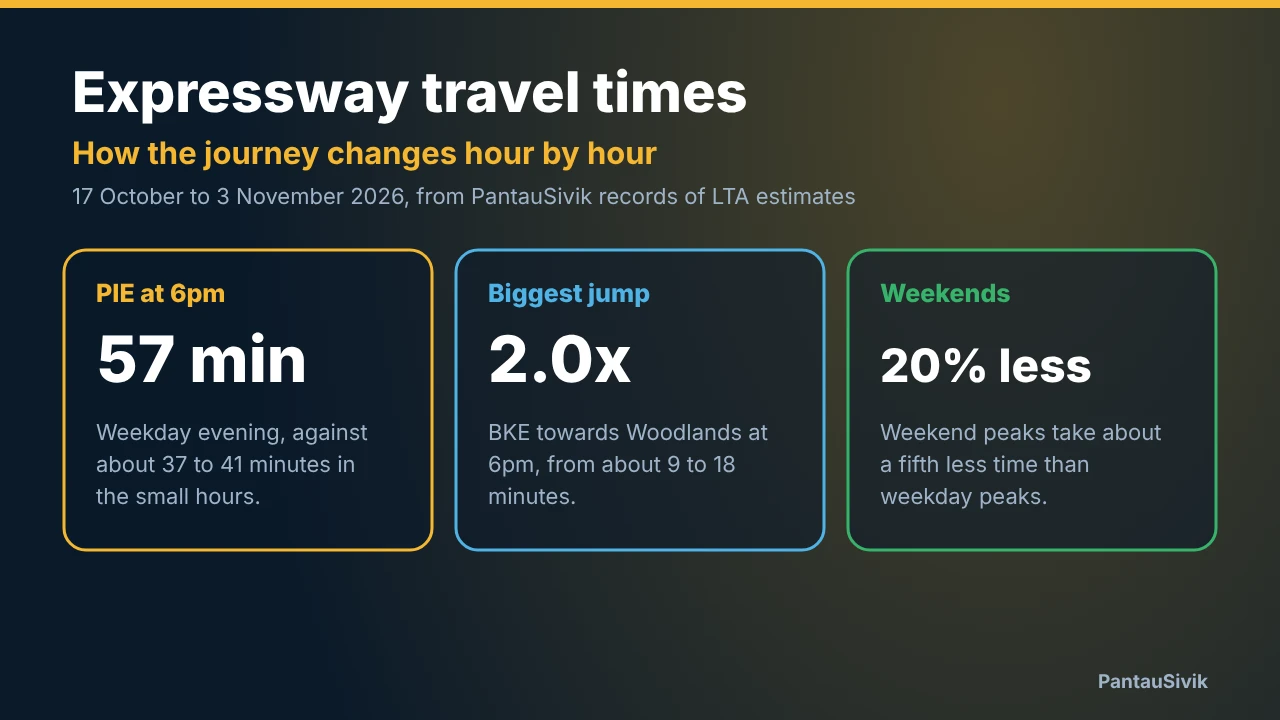
- On weekdays the Pan Island Expressway takes about 58 minutes at 6pm and about 39 minutes at 3am. On weekends the 6pm figure is about 45 minutes.
- The Tampines Expressway does it the other way round. Its weekday peak is at 8am, at about 18 minutes.
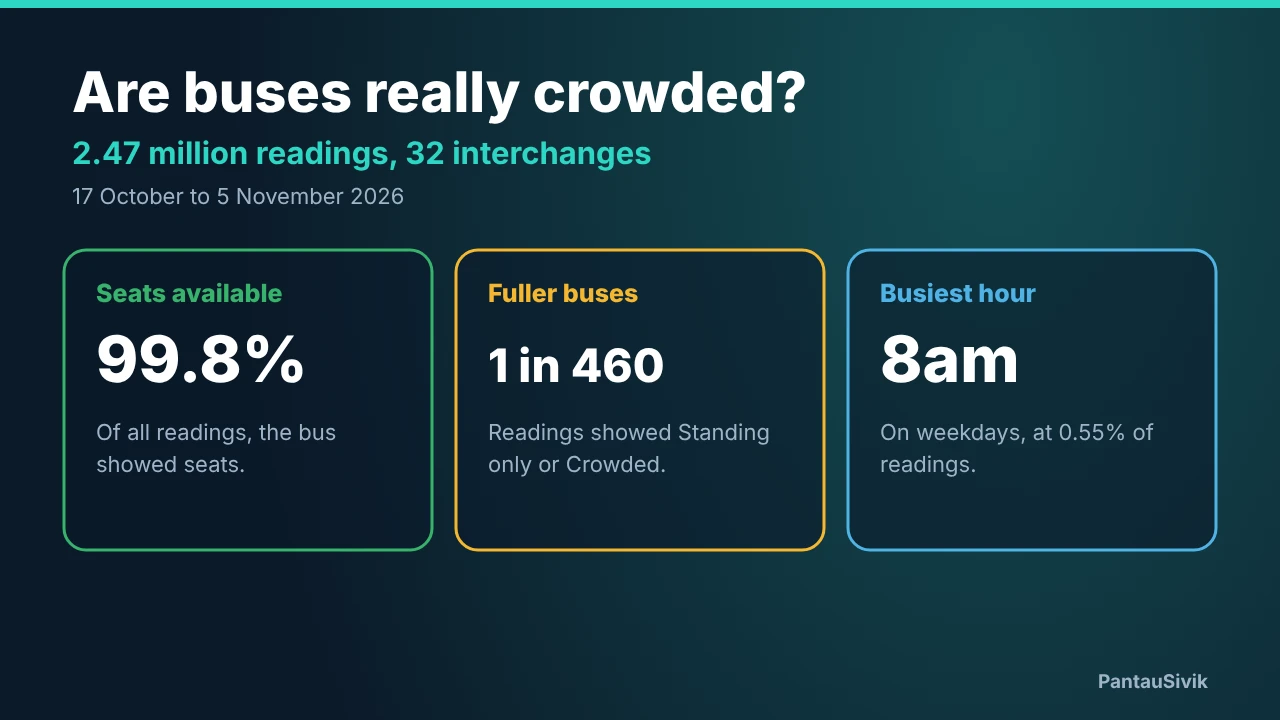
- About 0.2% of bus readings were Standing only or Crowded, roughly 1 in 540. The weekday peak is at 8am, at about 0.5%.
- Sengkang LRT had the highest share of platform readings rated high at its weekday peak: about 22% at 8am.
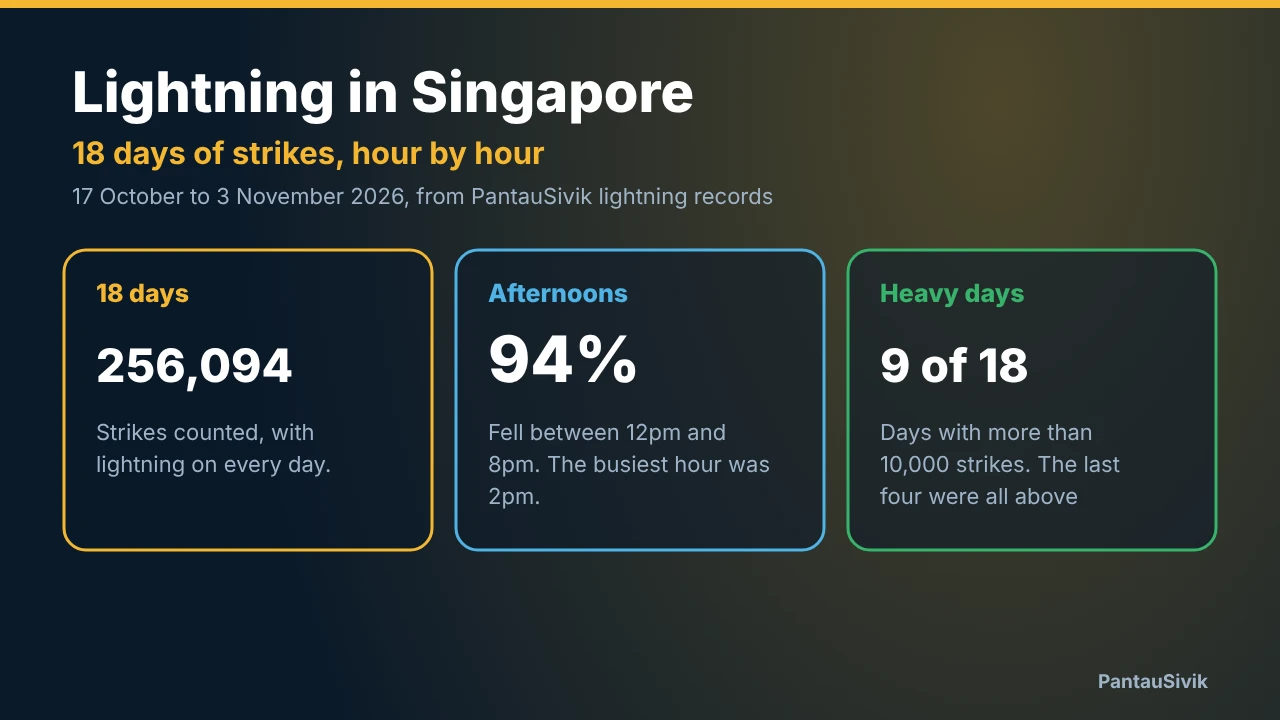
- About 87% of lightning strikes fell between 12pm and 6pm, and 2pm was the busiest hour.
Our posts go further into some of these, for example expressway travel times by hour, bus crowding and lightning in the afternoon.
Where the data comes from
Everything on these pages comes from public sources. Travel times, road speeds, bus load and platform crowd levels come from the Land Transport Authority DataMall. Lightning comes from the National Environment Agency through data.gov.sg. The alerts page also uses public Malaysian data such as MET Malaysia through data.gov.my.
The ZN Labs NADA engine collects those feeds, which arrive in different formats and at different speeds, and turns them into summaries that make sense, like an hourly average or a daily count. The same engine feeds the PantauSivik app. The charts use the Singapore Open Data Licence where it applies, and the sources are credited at the bottom of each page.
What History does not tell us
- It is not live. The charts update once a week, so for what is happening now use the app.
- It is not official statistics. We save what the feeds show, and the feeds have gaps. For example, we have no complete travel time data for 3 November.
- Road categories are shown as Category 1 to 8, because the authority does not give us a mapping to road types that we can confirm.
- Bus crowding covers the interchanges we collect, not every stop and not individual services.
- It is a little over three weeks of data, so it says little yet about what is normal across a whole year.
The History pages also have terms of use. In short, they are for your own information, you can quote a single figure with credit to PantauSivik, and scraping or automated collection, including by AI crawlers, is not allowed.
Common questions
What is the PantauSivik History section?
It is a set of chart pages on pantausivik.com that show the public data PantauSivik has saved since October 2026: expressway travel times, road speeds, bus crowding, MRT and LRT platform crowding, lightning and alerts, with week, month, year to date and year views.
How often is the History data updated?
Weekly. The date at the top of each chart page shows the last day of data. The charts are summaries of past readings, so for current conditions use the PantauSivik app.
Why are the Month, Year to date and Year buttons greyed out?
Each view needs enough data to be useful. Month needs 30 days, Year to date needs 90 days and Year needs 365 days. They switch on by themselves as the history grows.
Where does the History data come from?
The Land Transport Authority DataMall for travel times, road speeds, bus load and platform crowding, the National Environment Agency through data.gov.sg for lightning, and Malaysian sources such as MET Malaysia through data.gov.my for some alerts. The ZN Labs NADA engine collects and summarises it.
Can I reuse the History charts or data?
You can view them for your own information and quote a single figure with credit to PantauSivik. Scraping, automated collection and republishing are not allowed without written permission. The terms of use page has the details.
Sources: PantauSivik History pages, data from 18 October to 12 November 2026 in Singapore time. Data from the Land Transport Authority DataMall and data.gov.sg, made available under the Singapore Open Data Licence version 1.0, and from data.gov.my. PantauSivik saves its own readings and shows summaries of them, so these are not official statistics.
Information in PantauSivik comes from public sources and is there to help you plan. In an emergency, follow official channels. PantauSivik is independent and not affiliated with any government agency.
See also: History overview, History data terms of use, Expressway travel times by hour, Are Singapore buses crowded?, Lightning in Singapore, 17 October to 3 November, Public Alerts guide.