Home / Blog / Environment
Singapore week in data, 17 to 29 October: storms, slow roads and dengue clusters
PantauSivik has now logged 13 days of public data: lightning, road incidents, bus crowding, expressway travel times and dengue clusters. This is a round up of what 17 to 29 October looked like, with a closer look at dengue clusters at the end. It links to our earlier posts on each topic, and the numbers here come from our own records, so they are a record of what we logged, not an official count. All times are Singapore time. Saturday 17 October starts in the afternoon in most of our records.
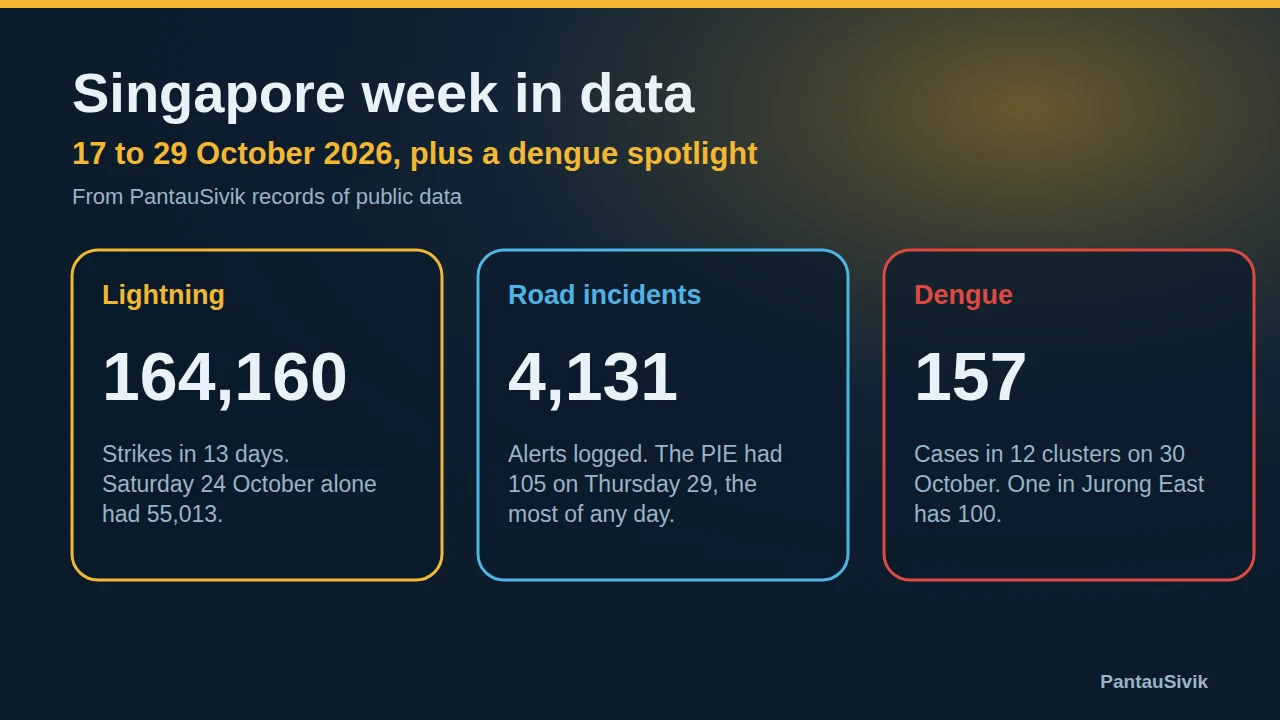
In short: lightning totalled 164,160 strikes, with two huge days, Saturday 24 and Wednesday 28. Road incident alerts reached 4,131, and Thursday 29 had the most on the PIE. The PIE at 6pm took 66 minutes on Thursday 29, the slowest evening in our records. Buses stayed mostly seats, at about 1 in 464 readings showing Standing only or Crowded. For dengue, NEA data in the app listed 12 clusters with 157 cases on 30 October, and one cluster in Jurong East had 100.
Lightning: two huge days
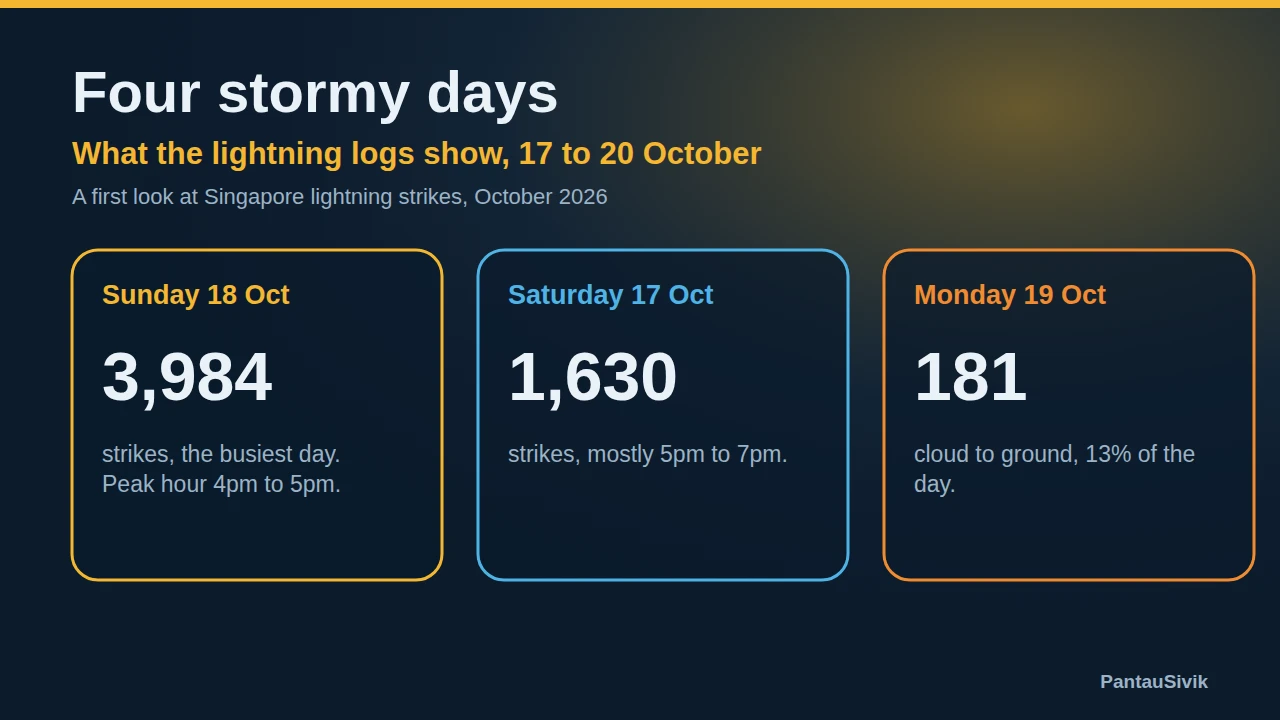
We counted 164,160 lightning strikes from 17 to 29 October. Most of them came on a few days. Saturday 24 October had 55,013 and Wednesday 28 October had 41,727, which together are 59% of the total. Sunday 25 October (20,004) and Tuesday 20 October (19,543) came next. Thursday 29 October had 11,611, with 3,723 of them in the 2pm hour. At the other end, Thursday 22 October had just 37 strikes and Monday 26 October 147.
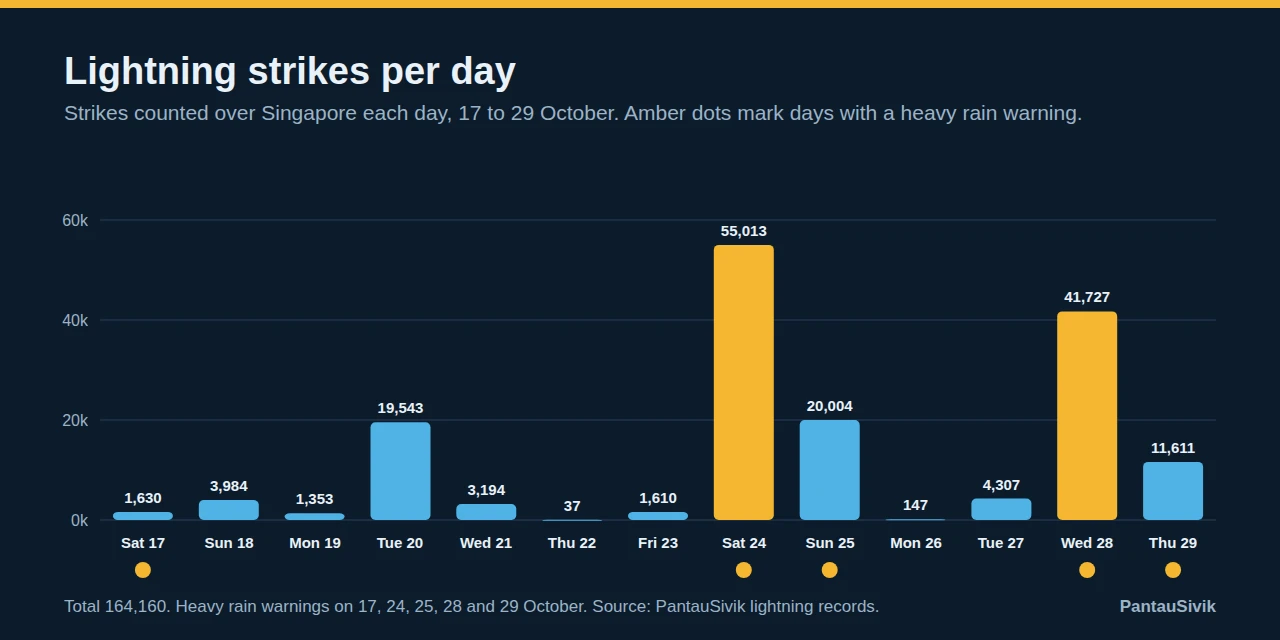
Heavy rain warnings were logged on five of the 13 days: 17, 24, 25, 28 and 29 October. On 29 October it ran from 4:40pm to 5:30pm. A warning and a lightning count are different things. Tuesday 20 October had 19,543 strikes and no warning, while 28 October had its busiest lightning hour, 2pm, in the gap between two warnings. For the details of the big days, see our posts on the 24 October storm and on the first four stormy days.
Road incidents: steady, with a busy Thursday
Our records hold 4,131 road incident alerts for the 13 days. A weekday usually brought 300 to 415 alerts, and weekends were quieter, with 263 on Saturday 24 and 254 on Sunday 25. Tuesday 27 stayed the busiest day with 415. Thursday 29 had 338, but it had the most accident alerts of any day so far, 63, and 105 alerts naming the PIE, the most of any day. That compares with 103 on Tuesday 27 and 99 on Friday 23.
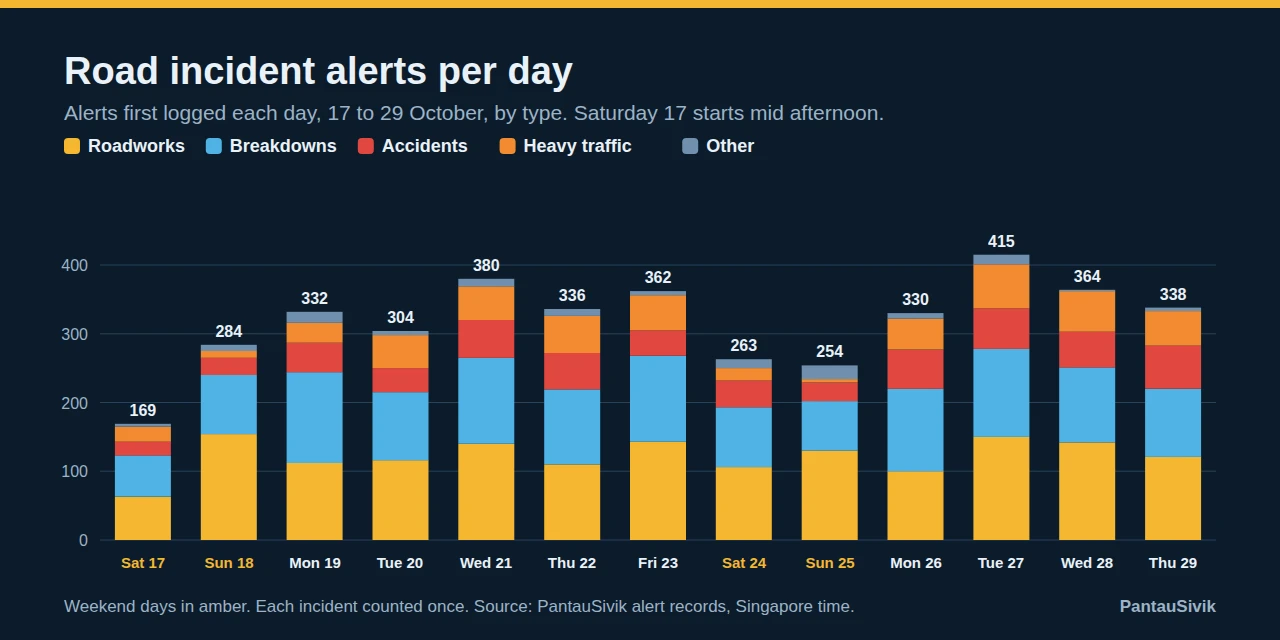
The mix hardly changed: roadworks and vehicle breakdowns made up the majority every day. Our full look at the first ten days, with charts by hour and road, is in Road incidents in Singapore.
The PIE at 6pm: 66 minutes
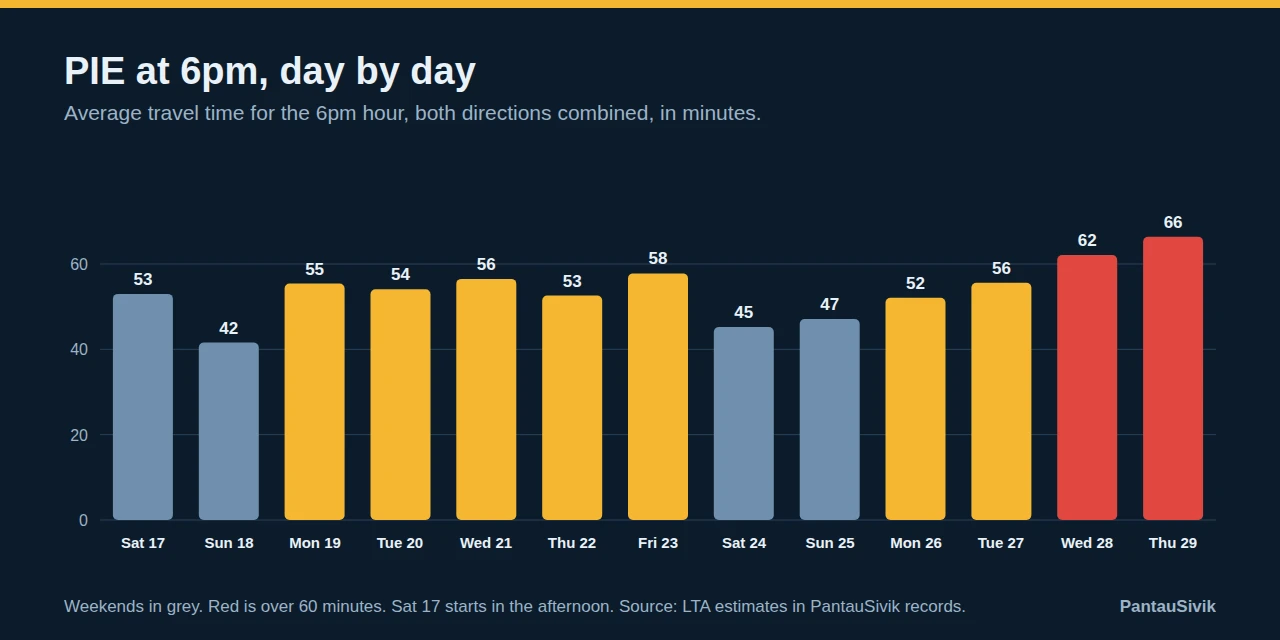
The PIE stretch LTA reports usually took 52 to 58 minutes at 6pm on weekdays, averaging both directions. That changed at the end of the window. Wednesday 28 October reached 62 minutes and Thursday 29 October 66 minutes, which is about 72 minutes towards Tuas and 60 towards Changi. Both days also had heavy rain warnings and many PIE incident alerts, but with two days we cannot say what caused it, or whether it will last. Sunday 18, Saturday 24 and Sunday 25 were the calmest evenings, at 42 to 47 minutes.
For how each expressway changes through the day, see Expressway travel times by hour.
Buses: still mostly seats
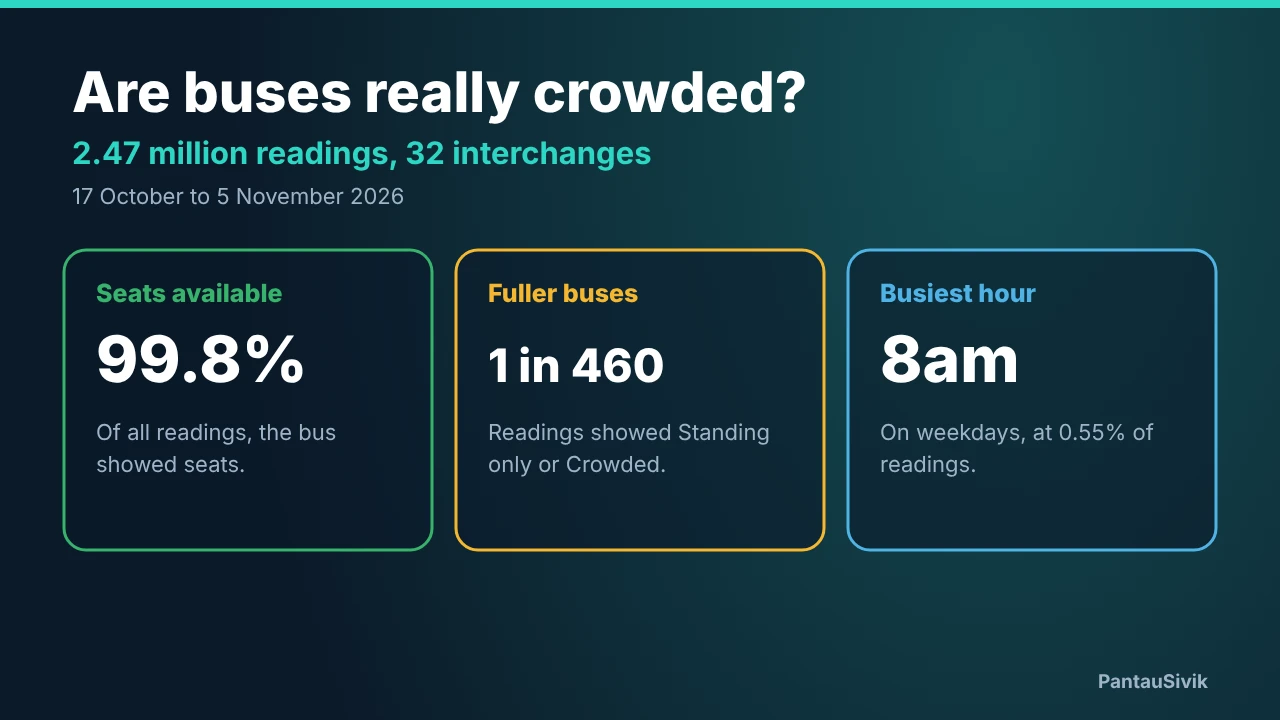
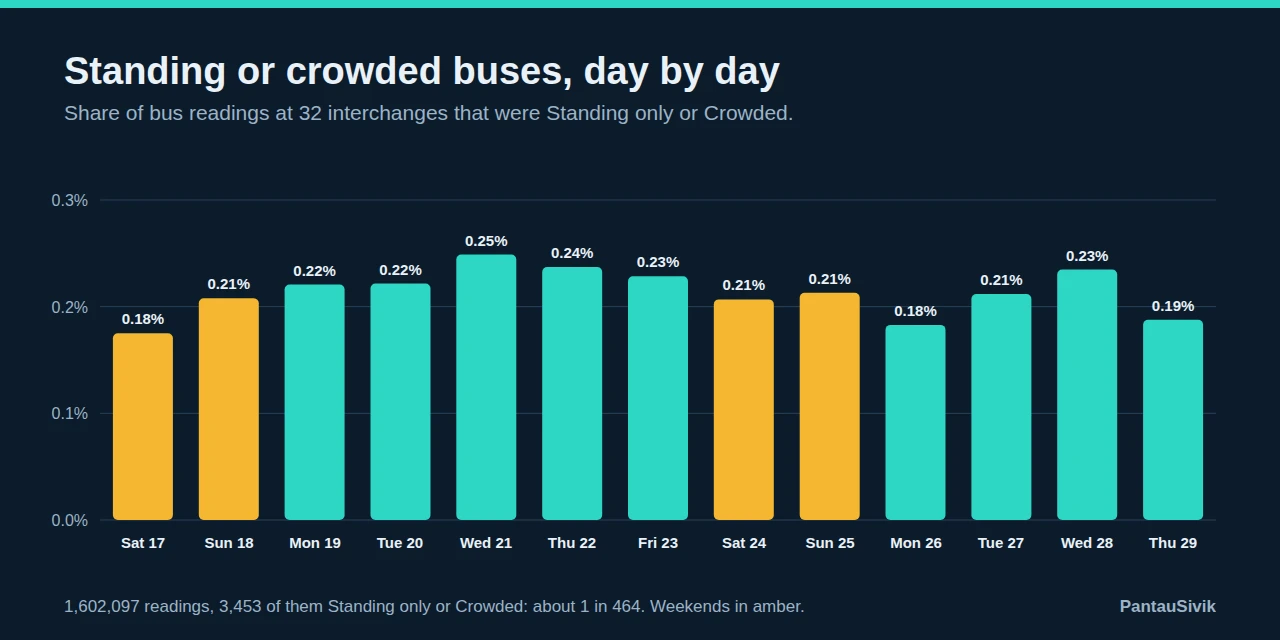
From 1,602,097 bus load readings at 32 interchanges, 3,453 showed Standing only or Crowded, which is about 1 in 464. The daily share stayed between 0.18% and 0.25% and ended at 0.19% on Thursday 29 October. The details, including the weekday morning peak at 7am, are in Are buses really crowded?.
Spotlight: dengue clusters
The app also logs "New dengue cluster" alerts, built from NEA's list of dengue clusters. NEA describes a cluster as a locality with active transmission, formed when two or more cases have symptom onset within 14 days and live or work within 150 metres of each other. We have not looked at these before, so this is a first look.
Counting alerts is misleading. We logged 65 dengue alerts from 17 to 29 October, but they point to only 16 different cluster names, and a few of those are the same cluster after its name changed. The same clusters come back each time NEA's list is refreshed, with the same place and a case count that may have grown. So we counted places, not alerts, and we only logged alerts on eight of the 13 days: none on 17, 20, 21, 27 or 28 October.
The snapshot on 30 October. The latest list in the app had 12 clusters with 157 cases. One of them is far bigger than the rest: the cluster around Ho Ching Road, Kang Ching Road, Tah Ching Road and Yuan Ching Road in Jurong East had 100 cases, about 64% of all cases listed. The next largest were Bishan Street 12 with 18 cases and the Lentor Gardens, Munshi Abdullah Avenue and Tung Po Avenue cluster in Ang Mo Kio with 16. The other nine clusters had 2 to 4 cases each. The cluster name in the alert text for Jurong East is cut short, so we only have its case count from the latest record, not how it grew.
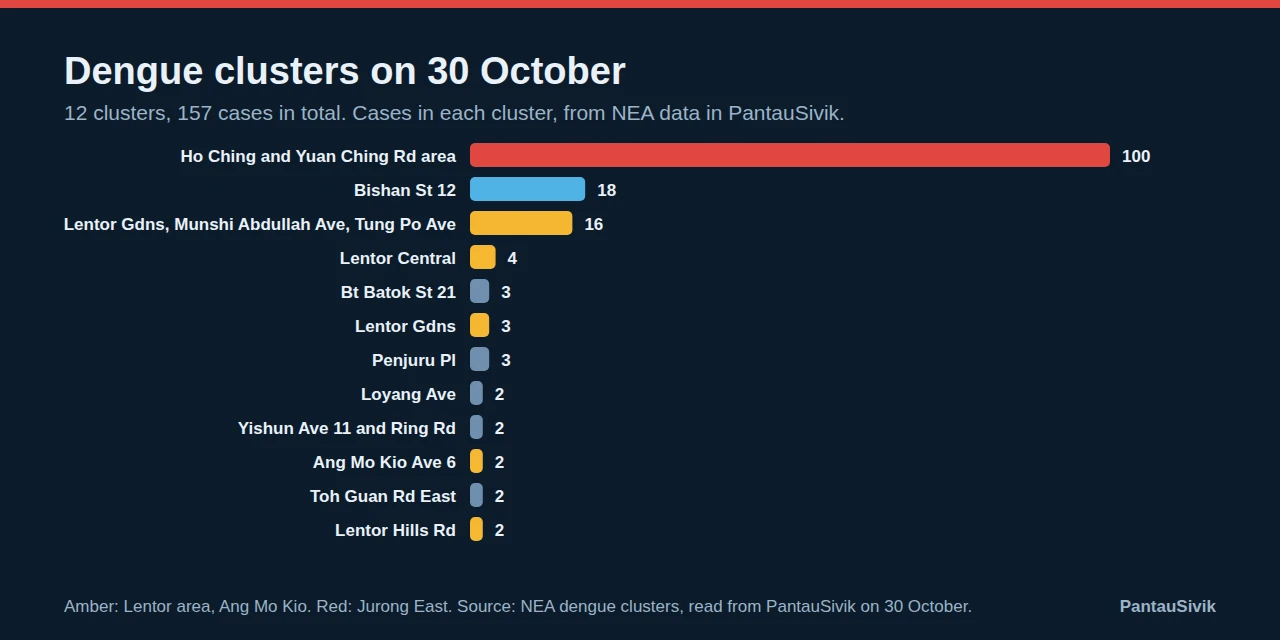
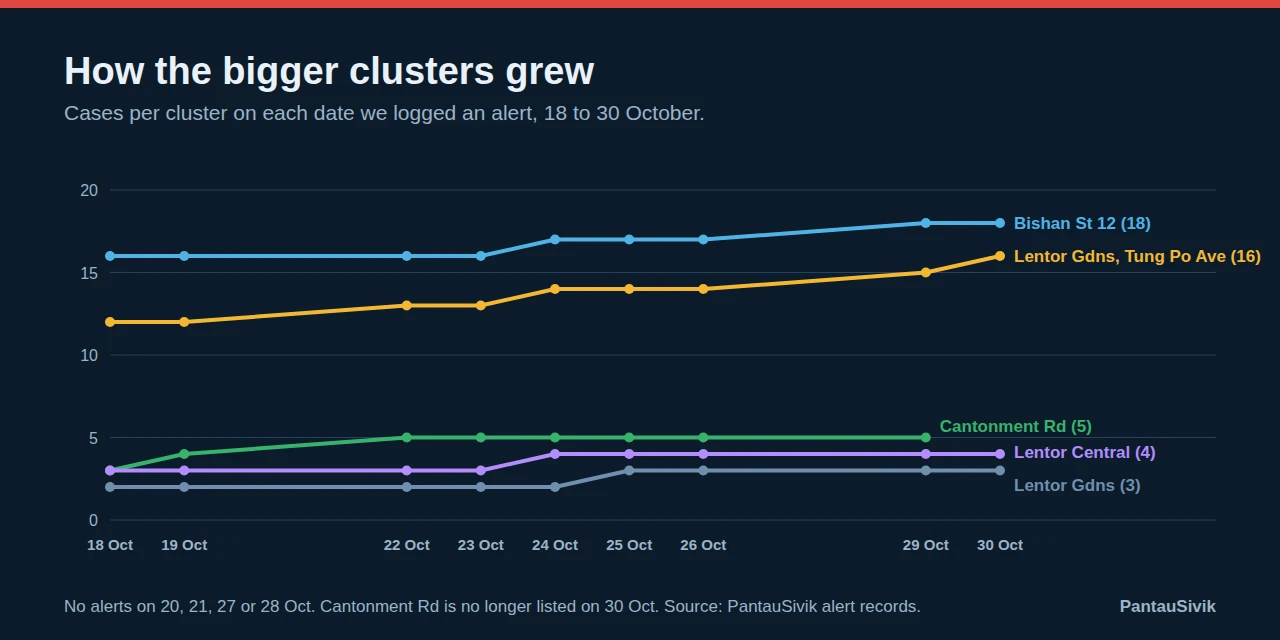
Lentor is the area to watch. Five of the 12 clusters, with 27 cases in total, are in the Lentor area of Ang Mo Kio. The biggest one grew from 12 cases on 18 October to 16 on 30 October, and the Lentor Gardens and Lentor Central clusters each gained a case. Bishan Street 12 went from 16 to 18. Other clusters appeared or changed: Bt Batok Street 21, Loyang Avenue and Yishun Avenue 11 first showed up on 30 October, and Toh Guan Road East and Lentor Hills Road in our alerts on 29 October. The Cantonment Road cluster (5 cases) and the Soon Lee Road cluster (2 cases) were not listed on 30 October. That may mean they were closed, but we cannot tell.
What dengue clusters mean for you
- A cluster means cases close together in place and time. It does not mean everyone nearby is at risk, and the list changes often.
- NEA's general advice is to stop mosquitoes from breeding: do not leave water standing in pots, trays, gutters or containers, and use repellent. See the NEA website for the latest advice and map.
- If you have a fever and think it could be dengue, see a doctor.
- In PantauSivik, choose which alerts you see under Public Alerts. The Public Alerts guide explains each category.
What this does not tell you
- These are records from PantauSivik, built on public data, and some days are partial. They are not official totals.
- Lightning counts say nothing about where a strike landed or whether it reached the ground.
- Incident alerts count notices, not crashes. Travel times are LTA estimates.
- Dengue clusters change daily. The 30 October figures are a snapshot, and the case counts are not a count of new cases that day.
- 13 days is short, so none of this shows a trend.
The charts behind this post are kept up to date on the History pages: lightning, expressway travel times, bus crowding and alerts.
Common questions
How many lightning strikes did PantauSivik record from 17 to 29 October 2026?
164,160 strikes over 13 days. Saturday 24 October was the biggest day with 55,013, followed by Wednesday 28 October with 41,727. Thursday 22 October had only 37.
How many dengue clusters were there in Singapore on 30 October 2026?
12 clusters with 157 cases in total, according to the NEA data in PantauSivik. The largest, around Ho Ching Road and Yuan Ching Road in Jurong East, had 100 cases. Lists change often, so check the NEA website for the latest.
What is a dengue cluster?
NEA describes a cluster as a locality with active transmission, formed when two or more cases have symptom onset within 14 days and live or work within 150 metres of each other.
How slow was the PIE on Thursday 29 October?
At 6pm the PIE stretch LTA reports took about 66 minutes, both directions averaged. It was about 72 minutes towards Tuas and 60 towards Changi. Weekdays before 28 October were mostly between 52 and 58 minutes.
Sources: PantauSivik records of public data, 17 to 29 October 2026 (lightning, road incident alerts, bus load readings at 32 interchanges, LTA expressway estimated travel times), and NEA dengue cluster data as shown in the app, read on 30 October 2026.
Information in PantauSivik comes from public sources and is there to help you plan. In an emergency, follow official channels. PantauSivik is independent and not affiliated with any government agency.
See also: The 24 October lightning storm, Road incidents, 18 to 27 October, Expressway travel times by hour, Are buses really crowded?, Public Alerts guide, Bus service alerts, 17 to 30 October, Singapore week in data, 30 October to 5 November.