Home / Blog / Environment
PSI, PM2.5 and Malaysia’s API: which air quality number should you check in Singapore and Malaysia?
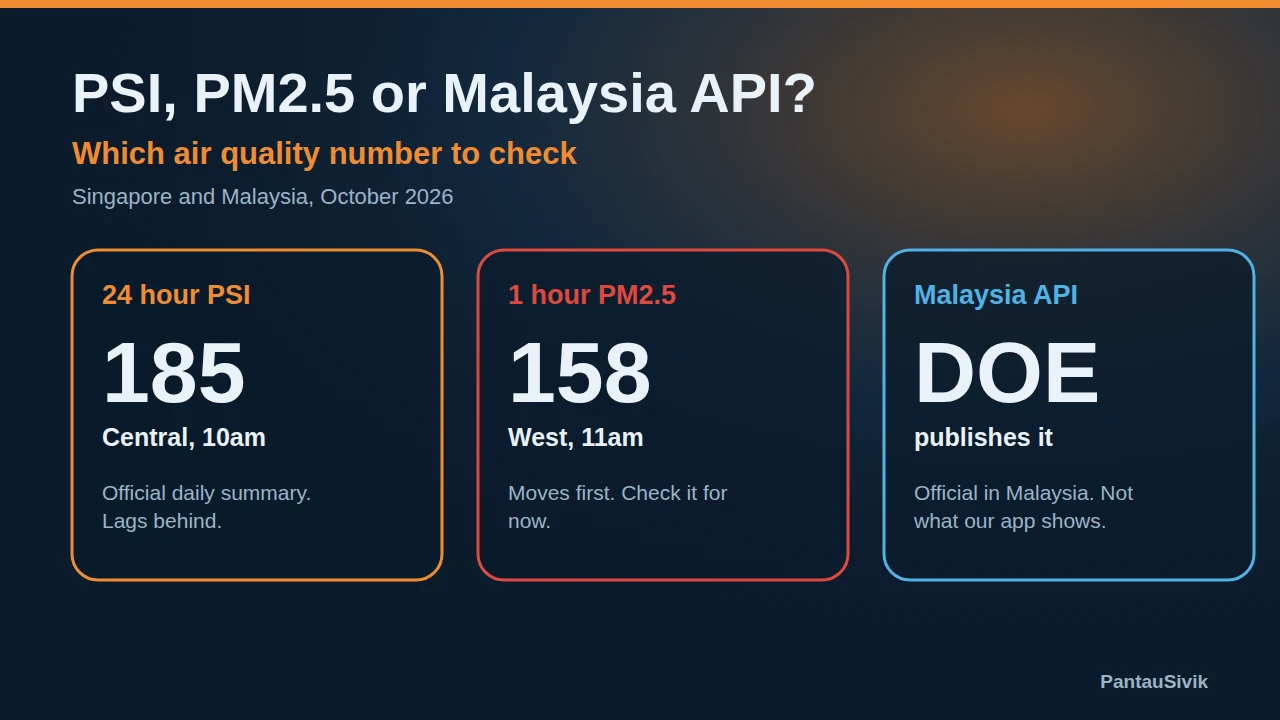
Check the air in Singapore or Malaysia and you will meet three different numbers: the PSI, the PM2.5 reading and, in Malaysia, the API. They sound alike, they share colours, and they do not always agree. On 17 October that gap was easy to see, so here is how to read each one and which to check first.
Short answer: for what the air is like right now, check the 1 hour PM2.5. For the official daily picture in Singapore, check the 24 hour PSI. In Malaysia the official number is the Department of Environment's API, and PantauSivik shows model based PM2.5 estimates for Malaysian towns, which are not the same thing.
The three numbers in a minute
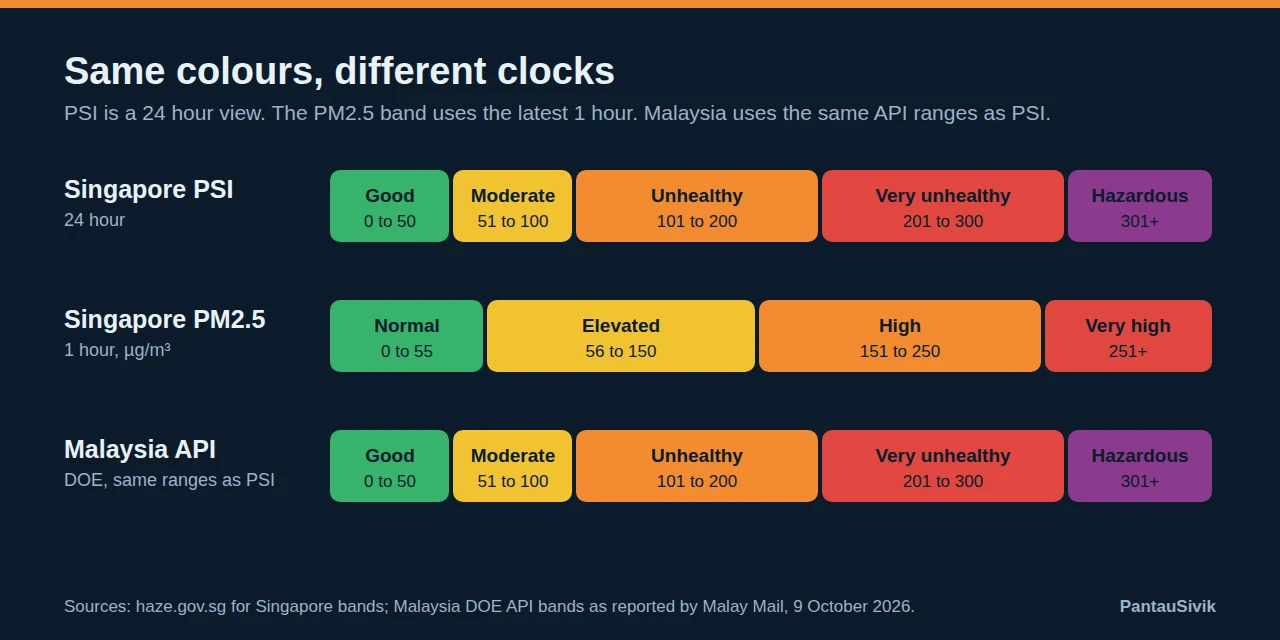
24 hour PSI. Singapore's Pollutant Standards Index is a 24 hour view of air quality. It is banded as Good (0 to 50), Moderate (51 to 100), Unhealthy (101 to 200), Very unhealthy (201 to 300) and Hazardous (301 and above).
1 hour PM2.5. This is the concentration of fine particles over the latest hour, in micrograms per cubic metre. The bands are Normal (0 to 55), Elevated (56 to 150), High (151 to 250) and Very high (251 and above). Both sets of bands are published on haze.gov.sg.
Malaysia API. Malaysia's Department of Environment (DOE) publishes the Air Pollutant Index through its APIMS site. The ranges match the PSI: Good 0 to 50, Moderate 51 to 100, Unhealthy 101 to 200, Very unhealthy 201 to 300 and Hazardous above 300.
Why they can disagree
At 10am on 17 October, the 24 hour PSI was 185 in the Central region, 176 in the West, 175 in the East, 156 in the South and 140 in the North. All five were in the Unhealthy band, and fine particles were the pollutant driving it.
An hour later, the 1 hour PM2.5 told a more varied story. The West was at 158, in the High band. The East (144) and Central (140) were Elevated, and the South (87) and North (83) were Elevated too, but well below the others. The 24 hour PM2.5 concentration behind the PSI ranged from 93 micrograms per cubic metre in the North to 136 in Central.
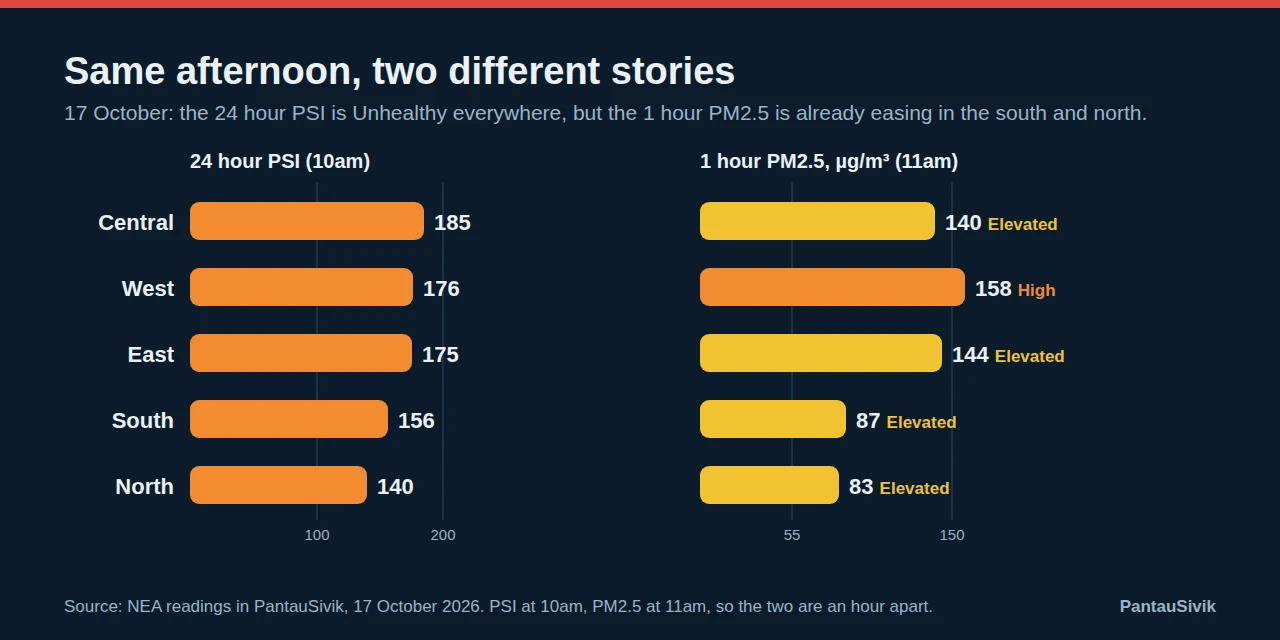
Neither number is wrong. The 24 hour PSI looks back over the past day, so it is slow to rise when the air gets worse and slow to fall when it improves. The 1 hour reading moves first. If you are deciding what to do in the next hour, it is the more useful one. If you want the official summary of the day, it is the PSI. For health advice at each band, follow NEA guidance.
What about Malaysia?
In Malaysia, the official reading is the API. On 9 October, for example, Bernama reported 36 areas in the Unhealthy band at 5.45pm, with Pasir Gudang the highest at 190, followed by Seremban at 189 and Segamat at 187 (via Malay Mail). Those are DOE readings.
PantauSivik does not show the DOE API. In the Malaysia section, the air quality figures are model based estimates from Open-Meteo for each town, shown as PM2.5 with an air quality band. They are not sensor readings, and they can differ from official API readings. Around midday on 17 October they ranged from 41.7 micrograms per cubic metre in Johor Bahru and Kulai, to 8.6 in Kuching.
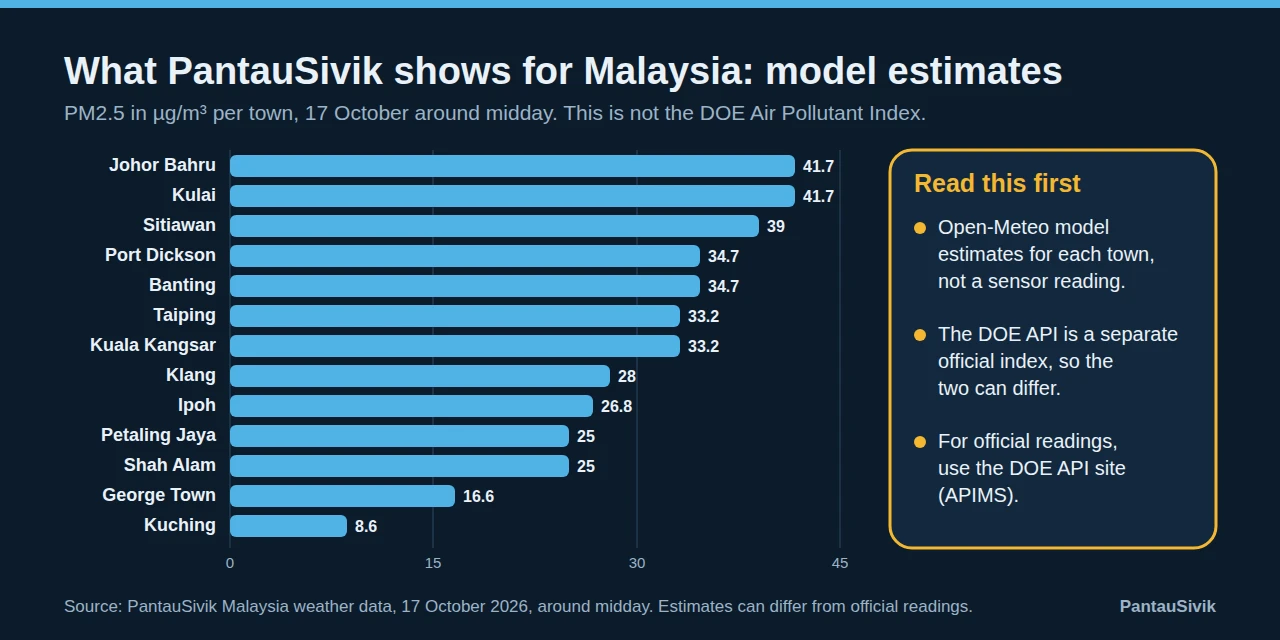
Treat these as a quick guide to where the air is cleaner or dirtier, and check the DOE's APIMS for official readings. We would rather say so plainly than let a model estimate be mistaken for a government reading.
Which one should you check?
- Right now, in Singapore: the 1 hour PM2.5 for your region.
- The official daily picture, in Singapore: the 24 hour PSI.
- In Malaysia: the DOE API for official readings, and the PantauSivik Malaysia page for a quick model based look.
Where to find them in PantauSivik
Open Weather to see the PSI and PM2.5 for your region. Switch on the Environment alert in Settings to hear when air quality gets worse or improves. For Malaysian towns, open the Malaysia section.
Read more: How to read weather, PSI, UV and heat stress in Singapore, Malaysia transit, weather and fuel prices in PantauSivik, Haze in Singapore, 2026 compared with 2023 and Does rain clear the haze?.
Common questions
Which air quality number should I check first?
For what the air is like right now, check the 1 hour PM2.5. For the official daily picture in Singapore, check the 24 hour PSI. They answer different questions, so it helps to look at both.
Why is the PSI Unhealthy when the PM2.5 says Elevated?
The 24 hour PSI looks back over the past day, so it can stay high after the air starts to improve. The 1 hour PM2.5 reflects the latest hour and moves first.
Is the Malaysia air quality in PantauSivik the same as the DOE API?
No. PantauSivik shows model based PM2.5 estimates for Malaysian towns. The Department of Environment publishes the official Air Pollutant Index, so use its APIMS for official readings.
Sources: haze.gov.sg for PSI and PM2.5 bands; Malay Mail, 9 October 2026 for the DOE API bands and readings; DOE APIMS; NEA readings and Open-Meteo model estimates in PantauSivik, 17 October 2026.
Air quality information comes from public National Environment Agency sources and Open-Meteo model estimates, and is there to help you plan. For health advice, follow guidance from the relevant authorities. PantauSivik is independent and not affiliated with any government agency.
See also: Haze in Singapore, 2026 compared with 2023, Does rain clear the haze?, Haze, heat and UV: check before you go, Three long weekends coming up.