Home / Blog / Environment
9,815 alerts in 19 days: what PantauSivik flagged, by type, day and hour
PantauSivik's Public Alerts are short notices built from public data: road incidents, lightning, heat, air quality, dengue clusters, bus disruptions and more. We keep a copy of each one, so we can count them. This post counts everything we logged over the 19 full days from Sunday 18 October to Thursday 5 November 2026. It is a count of our alerts, not of events. An alert says something was reported, and it does not measure how bad it was. All times are Singapore time.
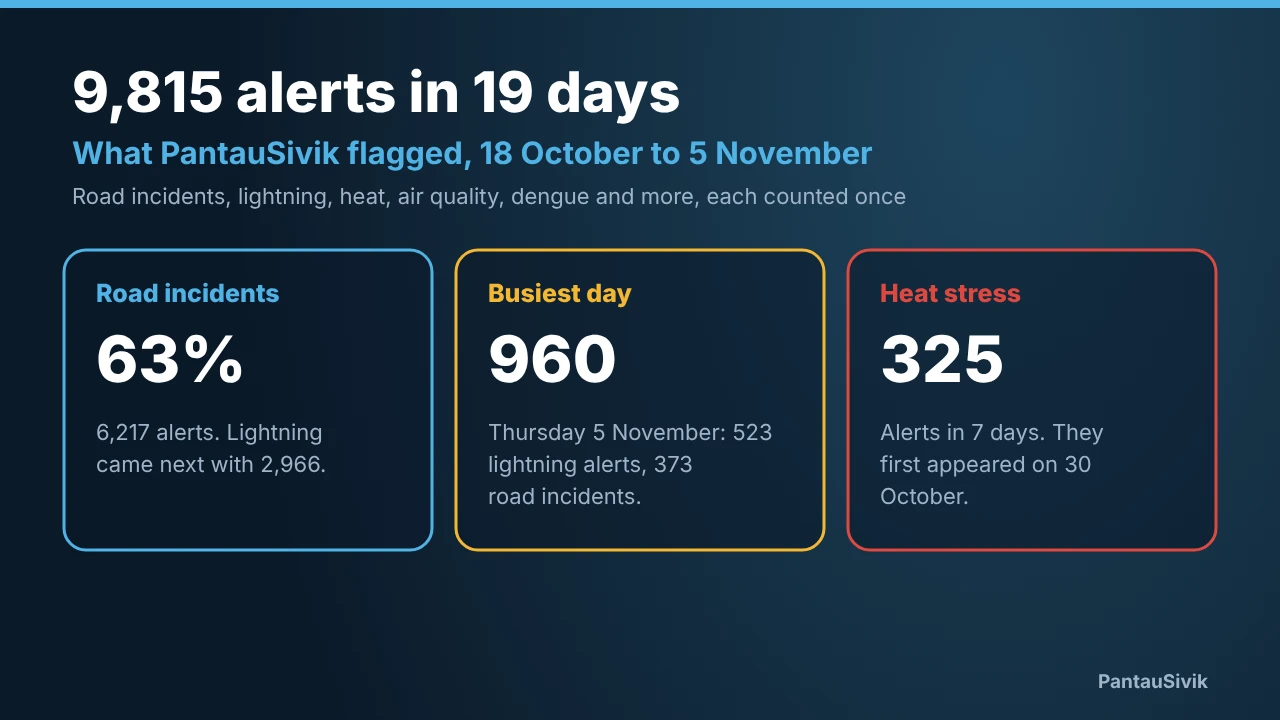
In short: we logged 9,815 distinct alerts, about 517 a day. Road incidents were 63% of them and lightning 30%. Thursday 5 November was the busiest day with 960 alerts, and 2pm was the busiest hour. Heat stress alerts only started on 30 October, and 108 of the 115 air quality alerts came in the first eight days.
How we counted
Our records keep one row for each sector an alert applies to, and some types add an island wide copy. A single road or dengue alert shows up as two rows, and a UV notice as 48. Counting rows would give 18,178. We count each alert once, by its source and ID, which gives 9,815. We left out Saturday 17 October because our records start that afternoon, and we left out test rows.
What kinds of alerts there are
| Type of alert | Alerts | Share |
|---|---|---|
| Road incidents | 6,217 | 63.3% |
| Lightning | 2,966 | 30.2% |
| Heat stress | 325 | 3.3% |
| Air quality | 115 | 1.2% |
| Dengue clusters | 78 | 0.8% |
| Malaysia (weather and air quality) | 55 | 0.6% |
| Bus and train service | 35 | 0.4% |
| Heavy rain warnings | 16 | 0.2% |
| Very High UV | 6 | 0.1% |
| Maintenance notices | 2 | 0.0% |
| Total | 9,815 | 100% |
Road incidents dominate because there are so many of them, and many are roadworks and breakdowns that last for hours. Lightning is second even though it only appears on storm days. Everything else is small by comparison, but a few of the small ones are new, which is why they are worth a look.
Busy days and quiet days
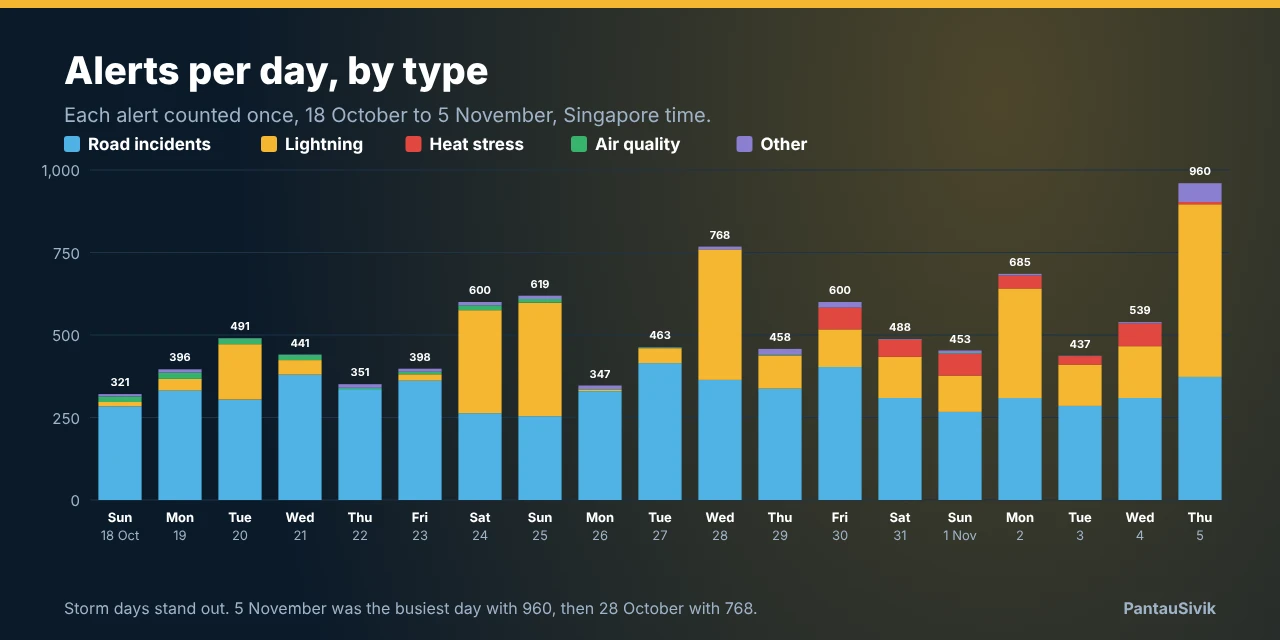
The range was wide. Thursday 5 November had 960 alerts, with 523 for lightning, 373 for road incidents and 55 from Malaysia, which we cover below. Wednesday 28 October had 768, Monday 2 November 685, Sunday 25 October 619, and Saturday 24 October and Friday 30 October 600 each. The quietest days were Sunday 18 October (321), Monday 26 October (347) and Thursday 22 October (351). Almost every busy day was a storm day. Road incidents moved far less, from 254 to 415 a day, so lightning explains most of the swings.
When alerts arrive
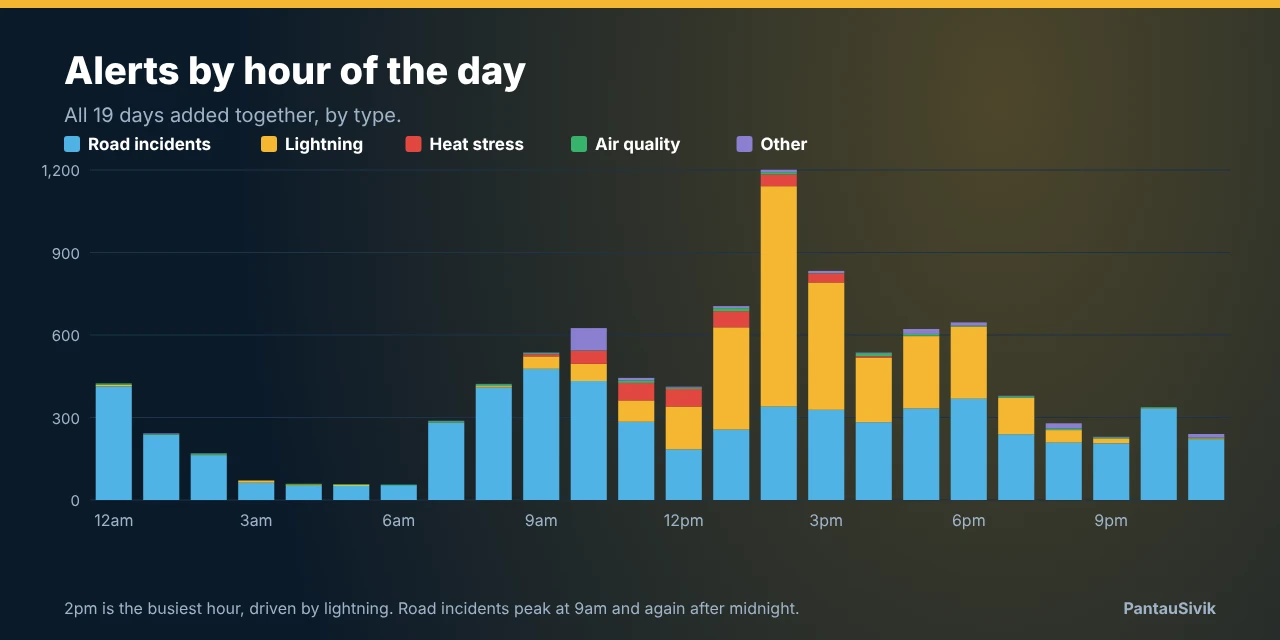
Added up over the 19 days, 2pm is the busiest hour with 1,201 alerts, and lightning is the reason: 801 of them. Lightning alerts also lead at 3pm (463) and 1pm (372). Road incidents follow the working day instead. They peak at 9am with 477 alerts, then at midnight with 413 and 8am with 409. The quietest stretch is the early morning, with between 56 and 71 alerts in each hour from 3am to 6am.
Heat stress: new since 30 October
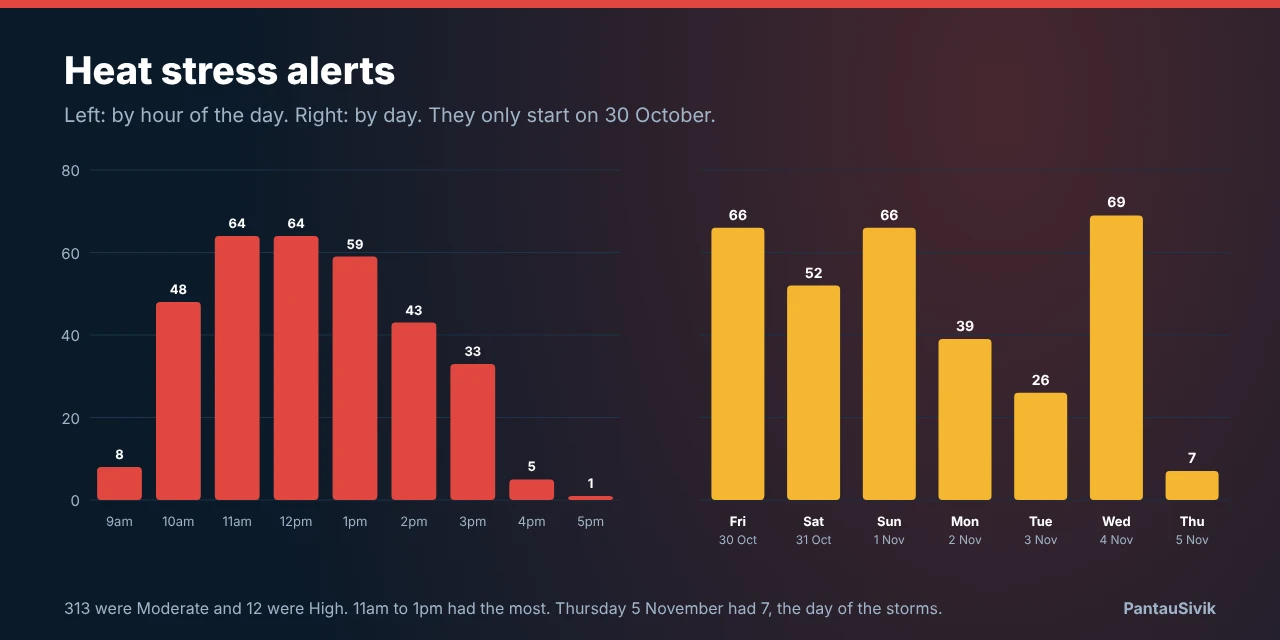
The first heat stress alert in our records is from 30 October, so we have only seven days of them. In that time we logged 325: 313 at the Moderate level and 12 at High. They arrive in the middle of the day, 64 each in the 11am and 12pm hours and 59 at 1pm, and almost none after 4pm. Wednesday 4 November had the most (69) and Thursday 5 November the fewest (7), the day of the storms. We cannot say why they only begin on 30 October, so please do not read this as heat being new.
Very High UV alerts follow the same afternoon pattern. We logged six, on 29 October, 30 October, 1 November, 3 November, 4 November and 5 November. Each was first flagged at 2pm or 3pm.
Air quality: busy at the start, quiet since
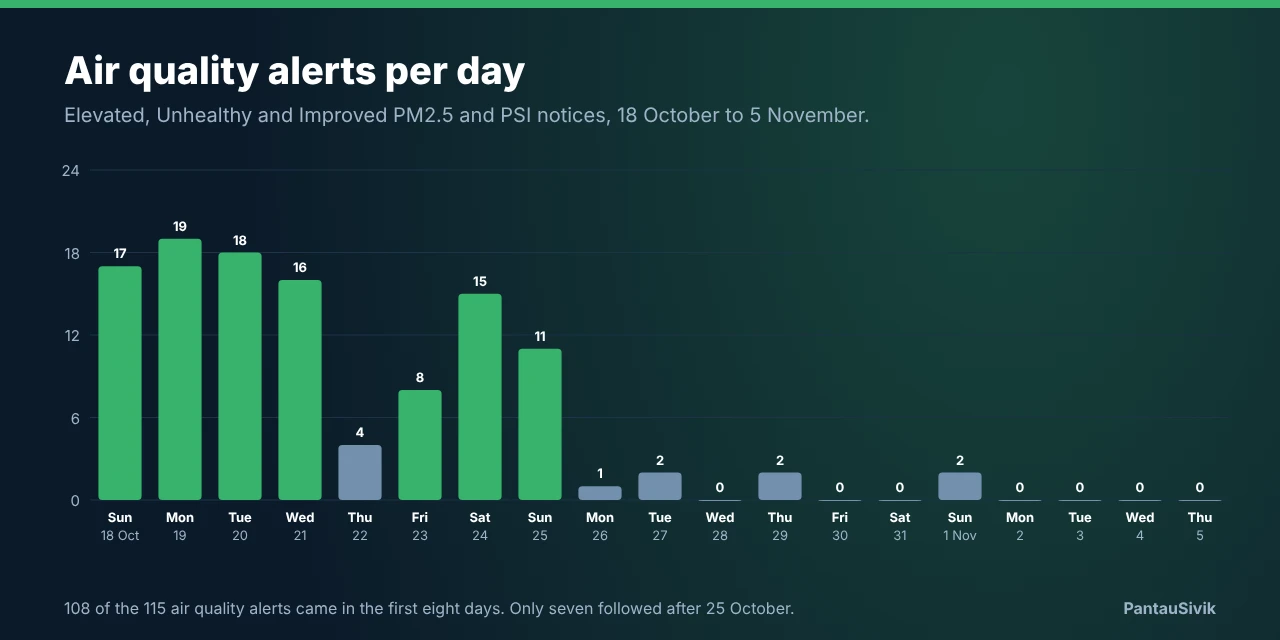
We logged 115 air quality alerts. They report PM2.5 and PSI readings for five regions, South, East, Central, West and North, as Elevated, Unhealthy or Improved. Of the 115, 108 came in the first eight days, 18 to 25 October, and only 7 after that. Seven alerts were Unhealthy, on 20, 23 and 24 October. Saturday 24 October was also our biggest lightning day, but the air quality alerts started well before it.
Thursday 5 November: Malaysia alerts appear
At 5:05pm on 5 November, 55 alerts for Malaysia arrived in our records. They are the first we have seen. Of the 55, 36 were weather warnings, such as thunderstorm warnings by state for Johor, Kedah and Kelantan, and 19 were "Air quality Unhealthy" readings. They are for Malaysia, but they are part of the 9,815 and of Thursday's 960.
The small ones
Dengue cluster alerts came to 78, and all but one were logged by 30 October, as we explain in the weekly roundup. There were 35 bus and train alerts, many of them about the 170 and 170X diversion. Heavy rain warnings numbered 16, on seven days: 24, 25, 28, 29 and 30 October, and 1 and 2 November. We logged two maintenance notices.
What this means for you
- In PantauSivik you choose which alerts you see under Public Alerts. The Public Alerts guide explains each category.
- If a type feels too busy, you do not have to switch everything off. Sector alerts let you focus on your home and work areas.
- A count of alerts is not a count of problems. Check the alert itself for the time, place and detail.
What this does not tell you
- These are our records of alerts built on public data. They are not an official count, and some alerts may have been missed or repeated.
- An alert is a notice. One road incident or storm can lead to more than one.
- Heat stress, UV and Malaysia alerts start partway through the period, so their counts are not comparable with the others.
- 19 days is short, and it includes several unusual storm days.
The alerts history page keeps these counts going, with a chart of alerts per day and by type.
Common questions
How many alerts did PantauSivik log from 18 October to 5 November 2026?
9,815 distinct alerts over 19 full days, about 517 a day. Our records hold 18,178 rows because many alerts are stored once per sector, so we count each alert once.
Which type of alert is the most common?
Road incidents. They were 6,217 of the 9,815 alerts, or 63%. Lightning alerts came next with 2,966, then heat stress (325), air quality (115) and dengue clusters (78).
When did heat stress alerts start?
The first one in our records is from 30 October 2026. By 5 November we had logged 325, of which 313 were Moderate and 12 were High. Most came between 10am and 2pm.
What was the busiest day for alerts?
Thursday 5 November 2026, with 960 alerts. That day had 523 lightning alerts, 373 road incidents and 55 Malaysia alerts. The next busiest was Wednesday 28 October with 768.
Sources: PantauSivik's own records of public alerts, 18 October to 5 November 2026 (19 full days, Singapore time), counted once per source alert.
Information in PantauSivik comes from public sources and is there to help you plan. In an emergency, follow official channels. PantauSivik is independent and not affiliated with any government agency.
See also: Week in data, 30 October to 5 November, Week in data, 17 to 29 October, Lightning in Singapore, 17 October to 3 November, How fast is Singapore's traffic?, Road incidents, 18 to 27 October, Bus service alerts, 17 to 30 October, Public Alerts guide.