Home / Blog / Getting around
How fast is Singapore's traffic, hour by hour? 18 days of road speeds
Our expressway post asked how long a trip takes. This one asks something wider: how fast are Singapore's roads moving, hour by hour, across the whole island? PantauSivik stores the LTA road speed bands for about 20,500 road links, one average per road category per hour. Here are 18 full days, from Sunday 18 October to Wednesday 4 November 2026, with five weekend days and 13 weekdays.
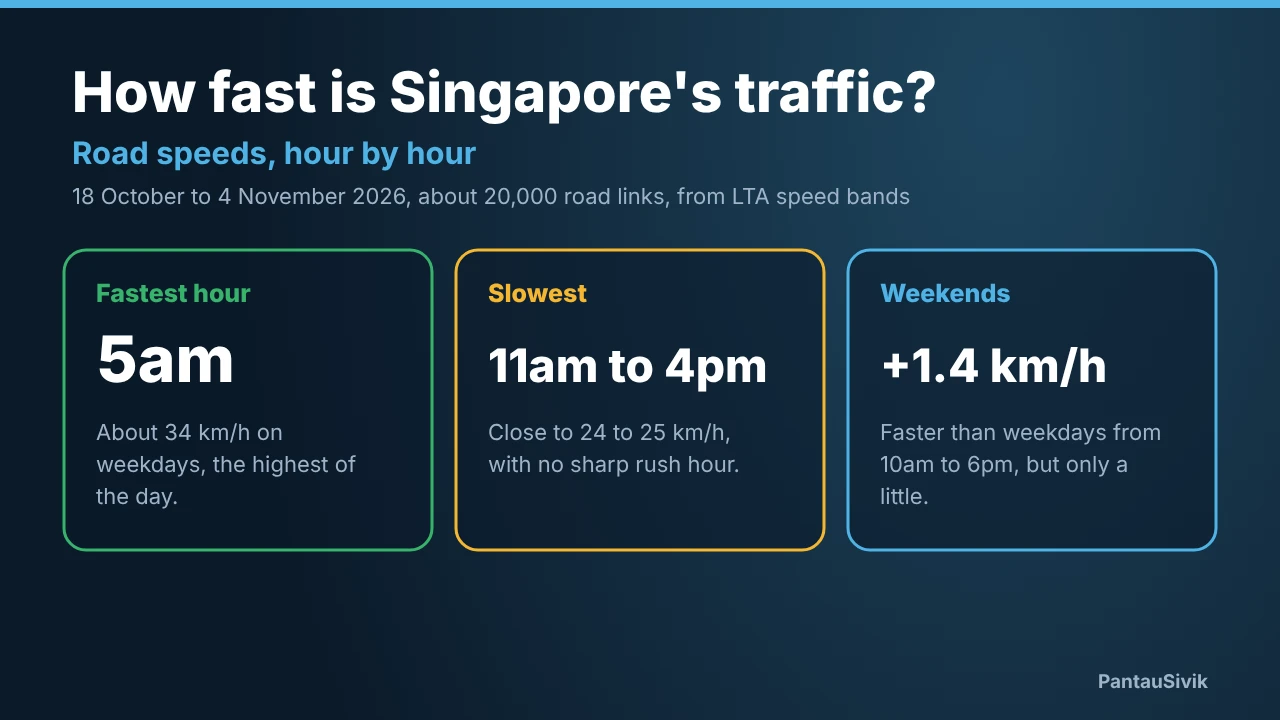
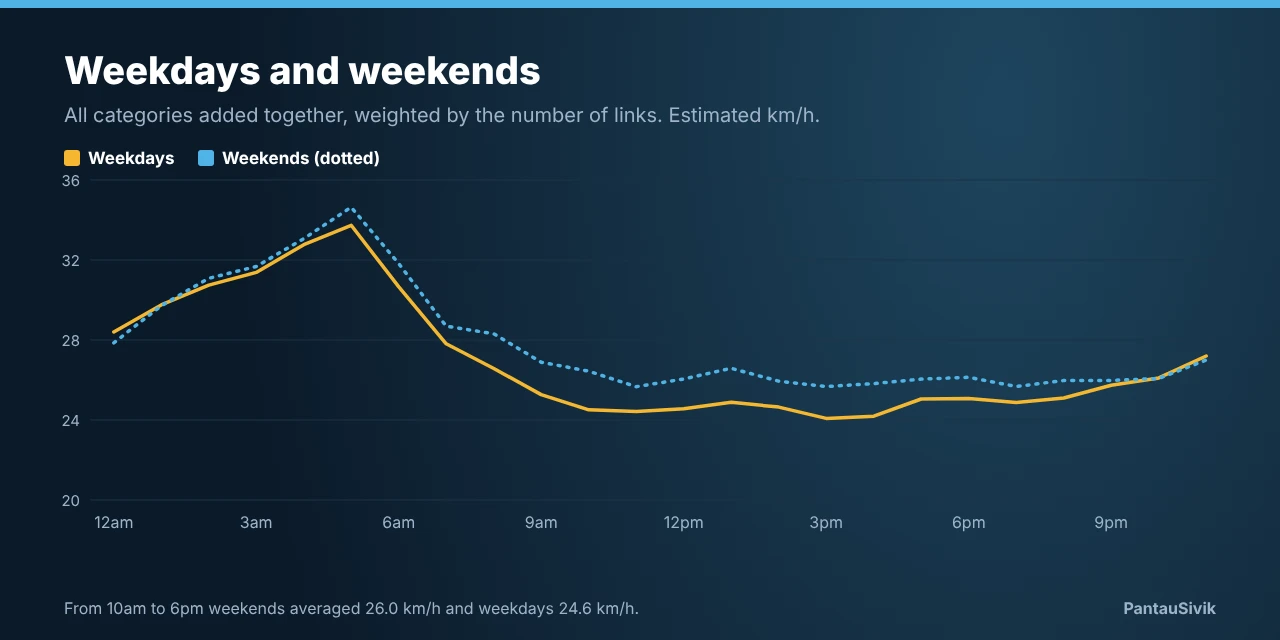
In short: roads are quickest at about 5am, when the average estimate was about 34 km/h on weekdays. By 10am it has fallen to about 24.5 km/h, and it stays between 24 and 25 km/h until about 4pm. The evening was no slower than the afternoon, and speeds climb again after 9pm. Weekends were about 1.4 km/h faster than weekdays from 10am to 6pm, and Sundays were the quick day.
What we measure
LTA gives each road link a speed band, from band 1 (0 to 9 km/h) up to band 8 (70 km/h or more). Every hour PantauSivik averages the bands, and the lower and upper speeds of those bands, for each of LTA's numbered road categories. To make the numbers easier to read we turn them into an estimated speed in km/h: the middle of the average lower and upper speed. It is an estimate of how fast roads move, not a measured journey time. All times are Singapore time.
LTA groups links into numbered road categories. We have not matched those numbers to named road types, so we show them as numbers. They differ a lot in size: category 5 has 8,090 links, category 4 has 6,850, category 2 has 3,597, category 3 has 1,492 and category 6 has 438. Two groups are left out. Category 1 has only 19 links and sat at the top band, 70 km/h or more, apart from a small dip to an average band of 7.5 at 6pm and 7pm. Category 8 has 14 links and showed the same band, 35 to 44 km/h, in every hour. For the island wide line we weight each category by its number of links.
The island wide day
The weekday curve has two parts: a fast night and a long, flat day. The 5am hour was the quickest, at about 34 km/h. Speeds then fall steadily, to about 31 km/h at 6am, 28 at 7am and 27 at 8am, and by 10am they are about 24.5 km/h. From 10am to 4pm the average stays between 24.1 and 24.9 km/h, with the lowest hour at 3pm, about 24.1 km/h. That is about 28% below the 5am figure.
The evening does not stand out. The 6pm hour averaged about 25.1 km/h, a little faster than 3pm, and speeds rise through the night, to 25.7 km/h at 9pm and 27.2 km/h at 11pm. In this average the roads behave as if the working day runs from about 8am to 8pm at the same slow pace, rather than having a sharp morning and evening peak.
Not every road moves the same
The categories behave differently, and that is why the island average is so flat. The roads in the smaller categories barely change, and the bigger ones change a lot.
- Category 2 (3,597 links): about 60 km/h in the 5am hour against about 37 km/h at 7pm, a drop of about 38%.
- Category 3 (1,492 links): about 54 km/h at 5am against about 32 km/h at 3pm, a drop of about 41%.
- Category 6 (438 links): about 44 km/h at 3am and 5am against about 26 km/h at 7pm, a drop of about 40%.
- Category 4 (6,850 links): about 31 km/h at 5am against about 23 km/h at 3pm, a drop of about 27%.
- Category 5 (8,090 links): about 20 km/h at 4am against about 18 km/h at 3pm, a drop of about 13%.
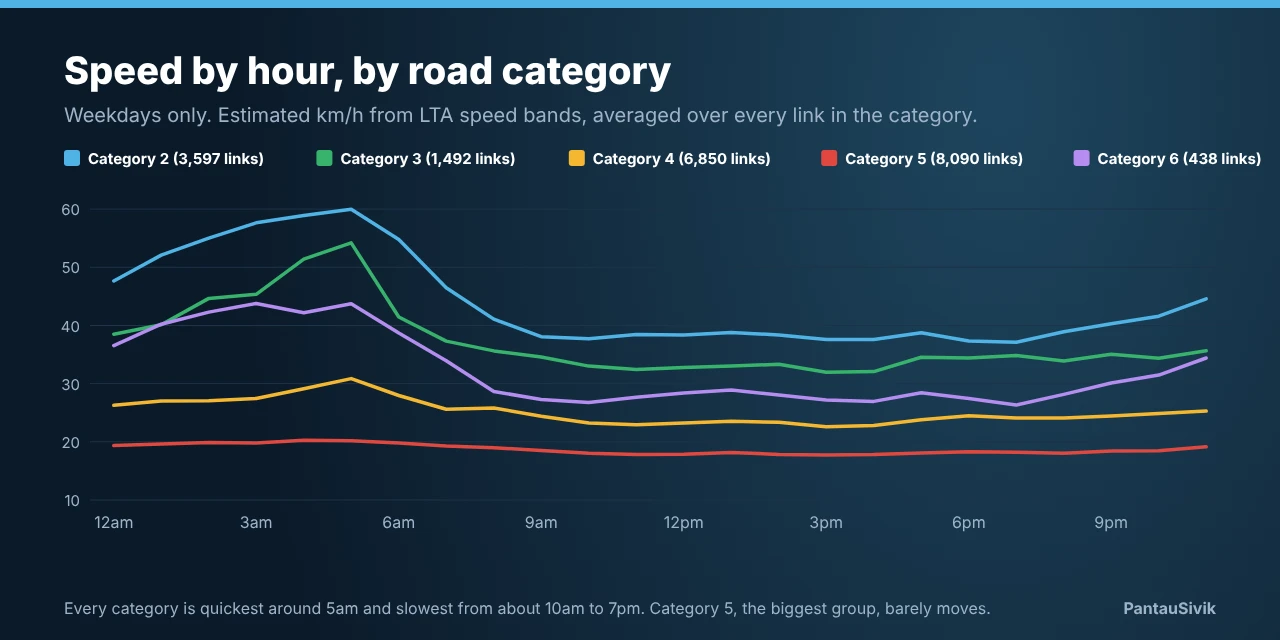
Category 5 is the biggest group and it hardly changes, at about 18 to 20 km/h all day and night. Because it has the most links it holds the island average down in the daytime, and it also means the average does not show a jam on a single road. The larger categories, 2, 3 and 6, are the ones where time of day matters most, and for those the slowest hour is the evening for categories 2 and 6 and the afternoon for category 3.
Weekdays, Saturdays and Sundays
From 10am to 6pm weekends averaged about 26.0 km/h against 24.6 km/h on weekdays, a gap of about 1.4 km/h. The weekend night is a little quicker too, at about 35 km/h in the 5am hour. But the weekend is really Sundays. Averaged over the whole day, the three Sundays came to about 28.3 km/h, while the two Saturdays came to about 27.2 and the 13 weekdays to about 27.0. Saturdays looked much like weekdays.
With only 18 days that is a pattern, not a rule. We saw no public holidays in this period, and the year end school holidays begin on 21 November, so the picture may change then. See our year end checklist for the dates.
Every day, hour by hour
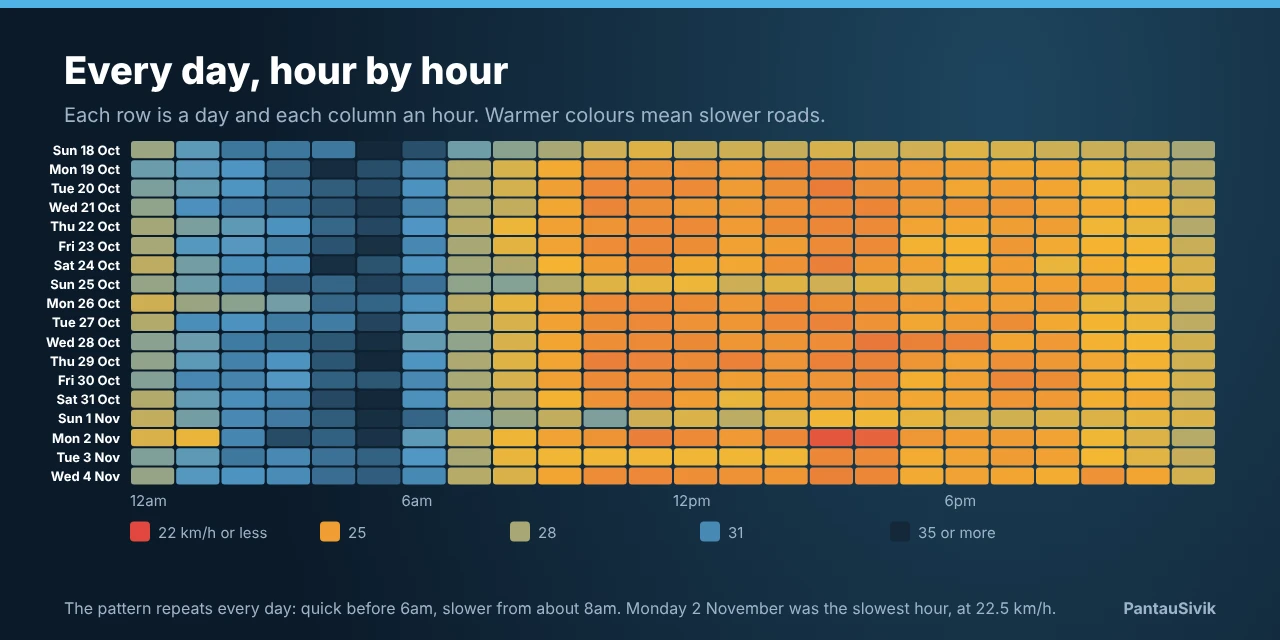
The heatmap shows the same shape every day: fast before 6am, slow from about 8am, and a slow stretch through the afternoon that lasts into the evening. The slowest hour of the 18 days was 3pm to 4pm on Monday 2 November, at about 22.5 km/h. That afternoon also had 40,421 lightning strikes, mostly between 1pm and 4pm, as we describe in our lightning post. A single day cannot show whether the storms slowed the roads, so we mention it as something to watch, not a finding.
What it means for you
- Early is fast. The best hours for a quick drive were before 6am. By 8am the roads were already about 21% slower than at 5am.
- Between 10am and 8pm the hour matters little on average. If your trip is flexible, moving it from 10am to 3pm will not change the island average much. The route and any incidents on it matter more.
- After 9pm roads quicken. The average climbs from about 25.7 km/h at 9pm to 27.2 km/h at 11pm.
- If you can choose, pick Sunday. It was the quickest day in this period. Saturday was not.
- Check your own roads. The island average hides jams. Open Traffic, choose Roads and pick a road category chip, or search for a road by name. For an expressway, look at its travel time gauge and open a camera. See the traffic guide.
What this does not tell us
- It is 18 days in one stretch of the year, so it does not show what is normal for Singapore. It also does not cover school holidays, public holidays or an F1 weekend.
- The speeds are estimates from LTA bands, and the averages are across thousands of links, so they say little about any one road or trip.
- We have not matched category numbers to road types, so we cannot say which category is an expressway or a side street.
- Our record for Saturday 17 October starts in the afternoon, so we left that day out.
- The data shows what happened, not why. We did not look at rain, incidents or events hour by hour.
The road speeds history page keeps these charts current, so you can compare any day or hour.
Common questions
What time is Singapore traffic fastest?
In PantauSivik records from 18 October to 4 November 2026, roads were quickest in the 5am hour. Averaged across about 20,000 road links, speeds reached about 34 km/h on weekdays and 35 km/h on weekends, an estimate from LTA speed bands. They fall quickly from 6am.
Is there a rush hour in Singapore road speed data?
Not a sharp one in our island wide average. Speeds drop from about 6am and are within 1 km/h of their daily low by 10am, then stay near 24 to 25 km/h until about 8pm. The evening hours were no slower than the afternoon. Averaging all roads hides local jams, so a single expressway can still have a clear peak.
Are Singapore roads faster on weekends?
A little, and mostly on Sundays. From 10am to 6pm weekends averaged about 26.0 km/h against 24.6 km/h on weekdays. Over whole days, Sundays averaged about 28.3 km/h, Saturdays about 27.2 and weekdays about 27.0, so Saturdays looked much like weekdays.
What do the road categories and speed bands mean?
LTA reports a speed band for each road link, from band 1 (0 to 9 km/h) up to band 8 (70 km/h or more). PantauSivik averages the bands by hour for each of LTA's numbered road categories. We have not matched the category numbers to road types, so we show them as numbers and as groups of roads.
How slow was the slowest hour in the 18 days?
The island wide average was lowest at about 22.5 km/h, from 3pm to 4pm on Monday 2 November. That afternoon also had 40,421 lightning strikes, but one day cannot tell us whether the storm slowed the roads.
Sources: PantauSivik's own hourly averages of Land Transport Authority road speed bands, 18 October to 4 November 2026 (18 full days), in Singapore time. Speeds in km/h are estimates from the average lower and upper speed of each band. Lightning counts are from PantauSivik records. Information may be revised if our records are corrected.
Information in PantauSivik comes from public sources and is there to help you plan. In an emergency, follow official channels. PantauSivik is independent and not affiliated with any government agency.
See also: Expressway travel times by hour, Road incidents, 18 to 27 October, Lightning in Singapore, 17 October to 3 November, Year end school holidays checklist, Traffic cameras and expressway travel times, Night road closures and bus diversions, Singapore week in data, 30 October to 5 November, Singapore week in data, 30 October to 5 November.