Home / Blog / Environment
Singapore week in data, 6 to 12 November: record lightning, a quiet Deepavali Monday and Malaysia alerts
PantauSivik now has four weeks of public data on file. This is the third weekly roundup. It covers Friday 6 to Thursday 12 November and updates the numbers from the second one, 30 October to 5 November: lightning, road incident alerts, the PIE at 6pm and buses, with short updates on dengue and heat. The last section covers Malaysia alerts, which grew a lot this week. Everything here comes from our own records of public data, so it is a record of what we logged, not an official count. All times are Singapore time.
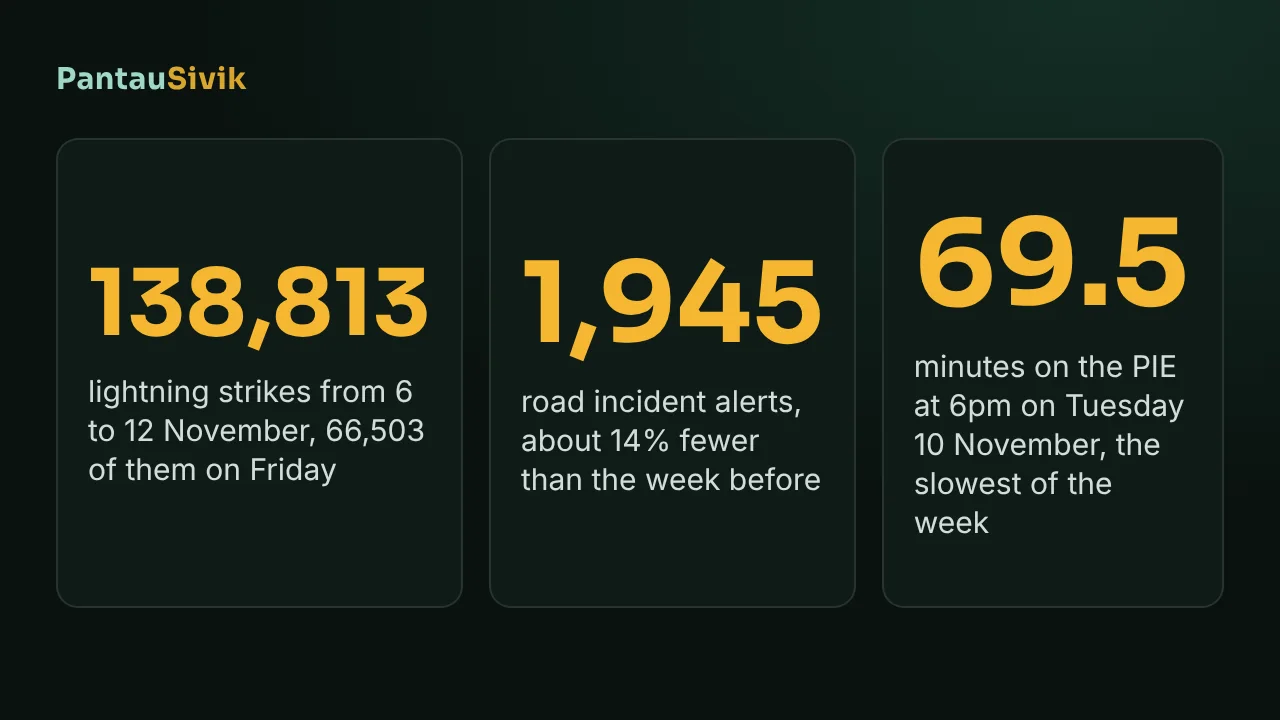
In short: lightning came to 138,813 strikes, 9% fewer than the week before, but it included our biggest day, 66,503 strikes on Friday 6 November. There were 1,945 road incident alerts, 14% fewer, and the Deepavali holiday on Monday 9 November was the quietest day with 147. The PIE at 6pm took 69.5 minutes on Tuesday 10 November, and that day had the most PIE incident alerts we have logged, 115. Buses were again mostly seats. Malaysia alerts went from 55 to 941.
Lightning: a record Friday, then a stormy holiday Monday
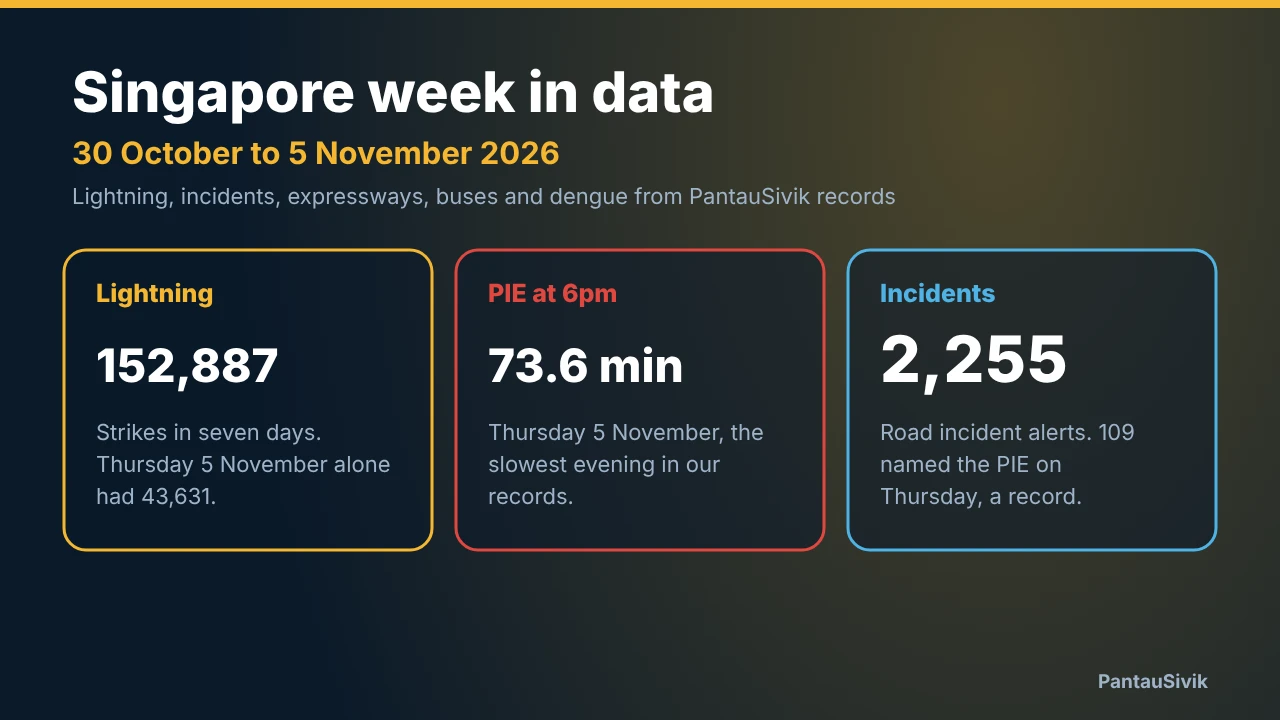
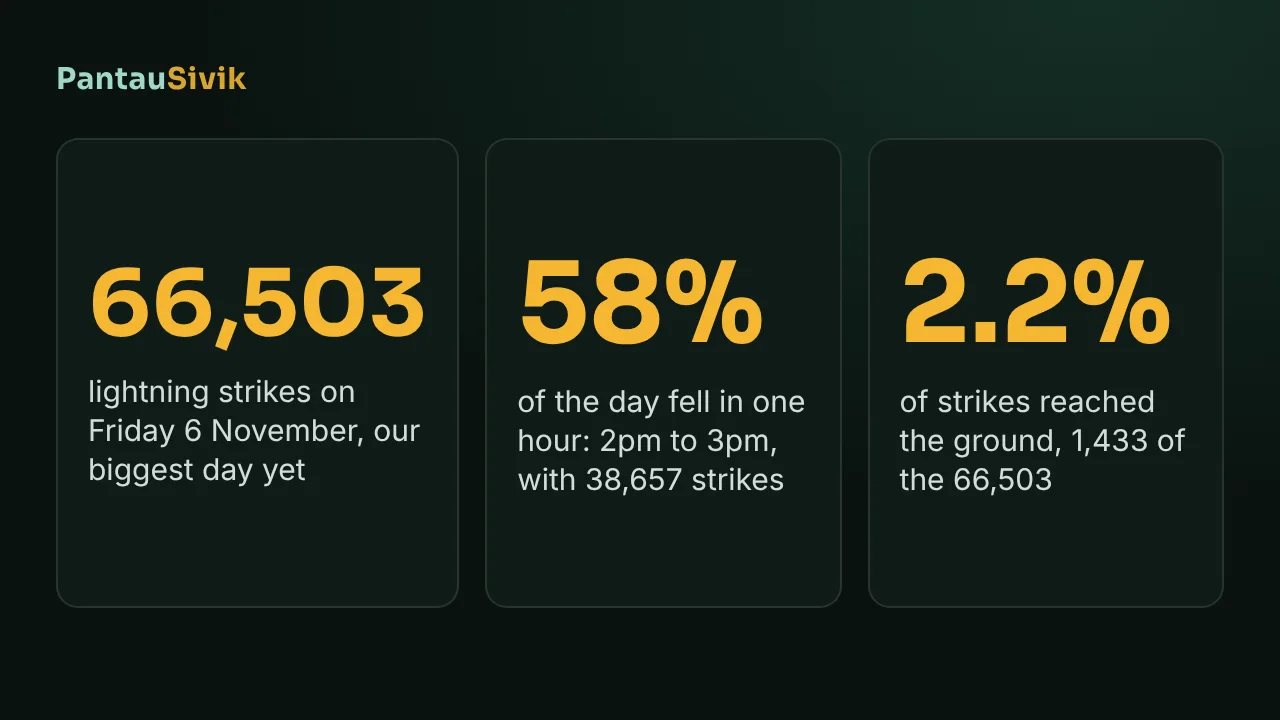
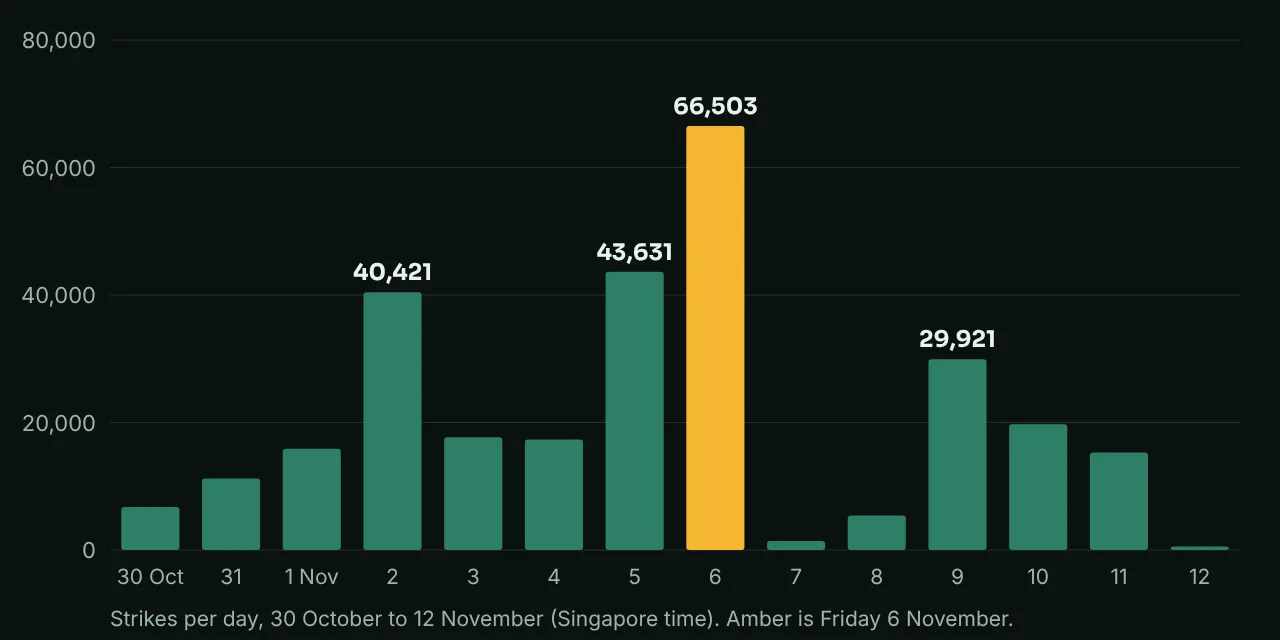
From 6 to 12 November we counted 138,813 lightning strikes, which takes the total since 17 October to 455,860. Friday 6 November had 66,503 of them, the most of any day on file. We looked at it in detail in Lightning in Singapore on 6 November, including the 38,657 strikes in the single hour from 2pm.
The rest of the week was lighter, but not quiet. Monday 9 November, the Deepavali holiday, had 29,921 strikes, the sixth biggest day so far. Tuesday had 19,737 and Wednesday 15,299. Then it stopped: Saturday had 1,407, Sunday 5,405 and Thursday 12 November only 541.
This time our records show heavy rain warnings on the days that matter. One was active on Friday from 2:31pm to 5:15pm, one on Monday from 12:01pm to 1:21pm, and one on Tuesday from 2:50pm to 4:41pm. The Friday one covers the 2pm hour that held most of the record. Thursday 5 November, one of the biggest days the week before, had no warning in our records, so a warning and a strike count do not always go together. Lightning alerts followed the strikes: 385 on Friday, 379 on Monday and 243 on Tuesday, against 15 on Saturday and 8 on Thursday. These counts are alerts logged, one for each sector reached.
Road incidents: fewer alerts, and breakdowns took the lead
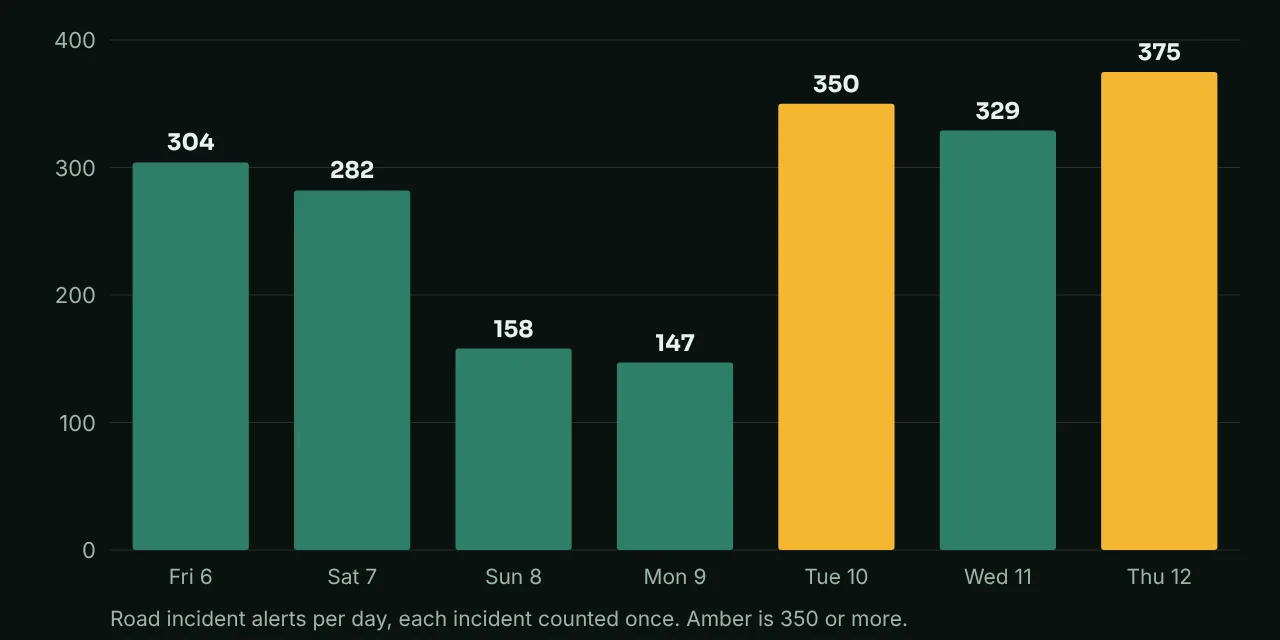
PantauSivik logged 1,945 road incident alerts over the seven days, counting each incident once, against 2,255 the week before. Vehicle breakdowns made up 709 of them, roadworks 651, accidents 278, heavy traffic 219 and other types 88. Last week roadworks led with 887 and breakdowns had 666, so roadworks fell by more than a quarter while breakdowns rose a little.
Thursday 12 November was the busiest day with 375 alerts, then Tuesday with 350 and Wednesday with 329. The quietest were Monday 9 November, the holiday, at 147, and Sunday 8 November at 158. Accident alerts peaked on Tuesday with 65, still below the 82 we saw on Friday 30 October. For expressways, we counted alerts that name a road. The PIE had 527 over the week, the AYE 233, the TPE 201, the BKE 175 and the SLE 165. Tuesday 10 November had 115 alerts that named the PIE, more than the 109 on 5 November, which was the old record.
The PIE at 6pm: two slow evenings, one very fast one
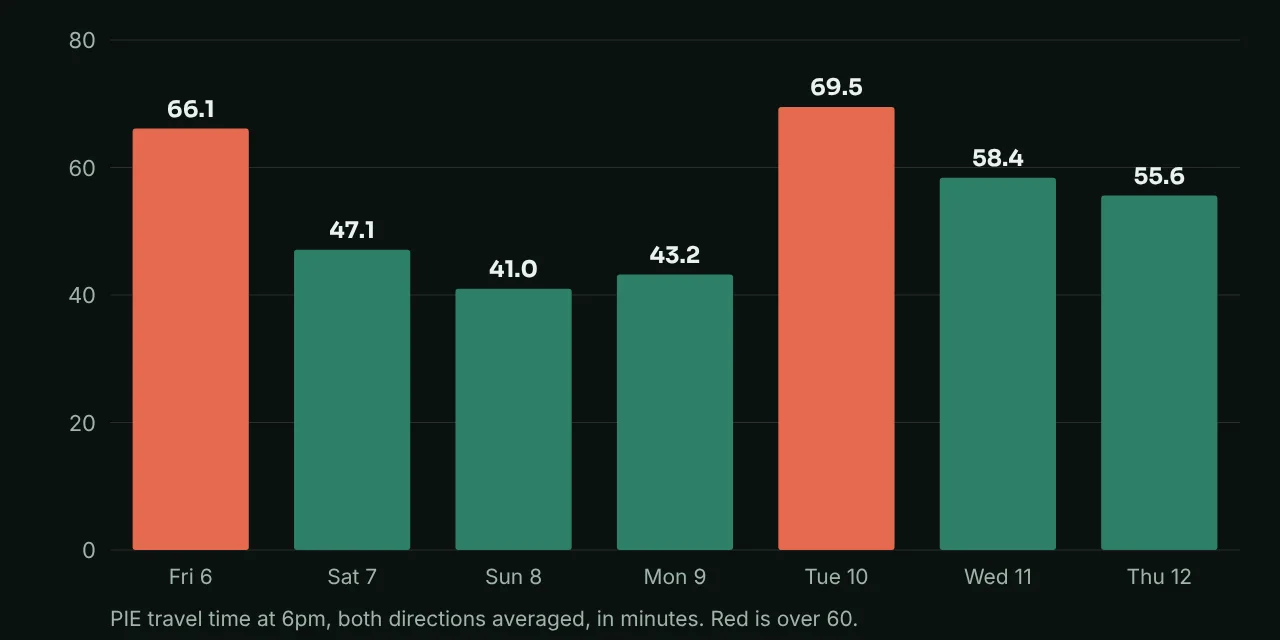
Averaging both directions of the PIE stretch LTA reports, 6pm took 66.1 minutes on Friday 6 November and 69.5 on Tuesday 10 November. Those are the second and third slowest evenings on file. The slowest is still Thursday 5 November, at about 74 minutes. The rest of the week was 58.4 on Wednesday and 55.6 on Thursday, 47.1 on Saturday and 41.0 on Sunday. Monday 9 November, the holiday, took 43.2 minutes, the quickest weekday evening in our records.
Tuesday had several things on the same afternoon: the most PIE incident alerts we have logged, 65 accident alerts across the island, 19,737 lightning strikes and a heavy rain warning from 2:50pm to 4:41pm. With this little data we cannot say which of them slowed the PIE, or whether they would again. For comparison, the usual weekday 6pm figure on the PIE is about 58 minutes.
For how each expressway changes through the day, see Expressway travel times by hour, or the charts on History: expressway travel times.
Buses: still mostly seats
This week we had 895,759 bus load readings from 32 interchanges. Of those, 1,708 showed Standing only or Crowded, about 0.19%, a little lower than the 0.22% the week before. The lowest day was Monday 9 November, the holiday, at 0.11% (135 of 126,090). The other six days ran from 0.18% to 0.22%. That fits what we see on weekday mornings, when the share is highest, and it was missing on a public holiday. Since 17 October the total is 0.21% of 3,496,296 readings.
The average hides large differences between interchanges. Eight of the 32 account for 99% of the full buses we saw, and the busiest hour is different at each one. We ranked them in Which bus interchanges get crowded?
Bus service alerts are a different feed. We logged 7 of them, against 14 the week before. On Friday 6 November services 2 and 24 were diverted because of an accident on Upper Changi Road East, and 96 and 151 because of a breakdown on Kent Ridge Crescent. On Wednesday 11 November services 10, 12, 14, 16, 16M, 32, 40 and 47 were delayed by up to 20 minutes by roadworks near East Coast Road, and 5, 23, 59, 518 and 966 by up to 25 minutes after an accident on the PIE towards Changi. Services 170 and 170X were on diversion in Woodlands on 11 and 12 November, as in our bus alerts post.
Dengue: four new cluster alerts
We logged four "New dengue cluster" alerts this week, from 6 to 9 November. On 6 November one was for Woodlands Street 41 (blocks 413 and 428) with 2 cases, and another for a larger cluster of 21 cases around Lentor Gardens, Munshi Abdullah Avenue, Tung Po Avenue and Yio Chu Kang Drive. On 8 November, Lor Ah Soo in Hougang (blocks 138 and 139) had 2 cases. On 9 November, West Coast Road near Clementiwoods Condo and Varsity Park Condo had 2. For the NEA weekly case numbers and the clusters we had on file, see our dengue post. The NEA website has the current map.
Heat and UV
Heat stress alerts came on every day. Thursday 12 November was the busiest with 134 logged, 128 of them Moderate and 6 High. Across the week 553 were logged, and about 90% came between 10am and 3pm. Very High UV alerts for Singapore were sent on Saturday 7 November and Thursday 12 November, which makes 8 days since they began on 29 October.
New in our records this week
- Malaysia alerts grew. We logged 941 this week, up from 55 in the two days the week before. They are 467 UV alerts, which began on 6 November, 335 weather warnings and 139 air quality alerts. The weather warnings named Sarawak (38), Sabah (32), Pahang (30), Johor (21) and Perak (20) most often. The UV alerts included Labuan, Melaka, Kuala Lumpur and Putrajaya.
- Maintenance notice. Our own NADA engines have scheduled maintenance on Sunday 15 November from 12am to 8am. During that time bus and MRT/LRT arrivals, the trip planner, traffic information and motoring information may be unavailable in PantauSivik.
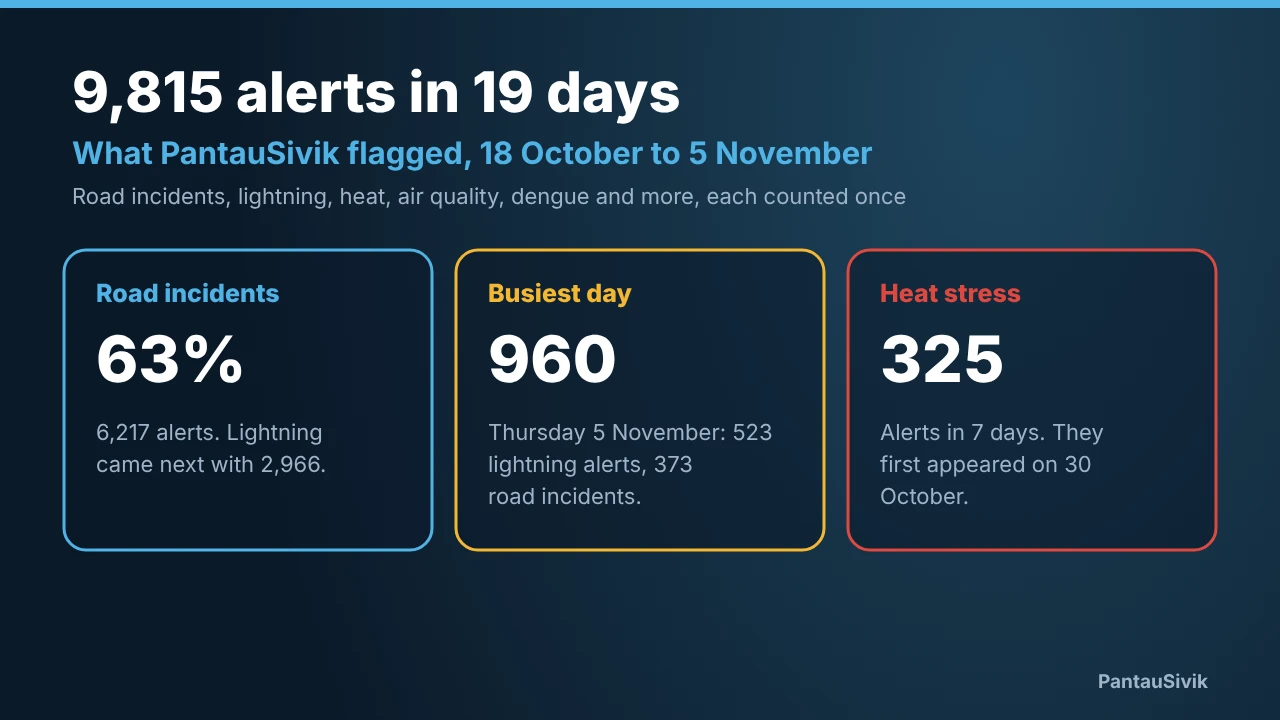
We put every type of alert side by side, by day and by hour, in 9,815 alerts in 19 days.
What this does not tell you
- These are records from PantauSivik, built on public data, and some days are partial. They are not official totals.
- Lightning counts say nothing about where a strike landed or whether it reached the ground, and a heavy rain warning is a separate notice.
- Incident alerts count notices, not crashes. Travel times are LTA estimates for the monitored stretches.
- Alerts logged can be sent once per sector, so a bigger number can mean more places reached, not more events.
- One slow PIE evening is not a trend, and four weeks is short. Our PIE figures for Tuesday 3 November are missing, so that day is left out.
Common questions
What happened with lightning in Singapore from 6 to 12 November 2026?
PantauSivik logged 138,813 lightning strikes, 9% fewer than the week before. The week included the biggest day on file, 66,503 strikes on Friday 6 November, and 29,921 on Monday 9 November. Heavy rain warnings were active on 6, 9 and 10 November.
How slow was the PIE at 6pm in the week of 6 to 12 November?
The PIE took 66.1 minutes on Friday 6 November and 69.5 on Tuesday 10 November, averaged over both directions. The quickest weekday evening on file was Monday 9 November, the Deepavali holiday, at 43.2 minutes.
How many road incident alerts did PantauSivik log from 6 to 12 November?
1,945, counting each incident once, against 2,255 the week before. Vehicle breakdowns were the biggest type with 709, then roadworks with 651 and accidents with 278.
Were Singapore buses crowded from 6 to 12 November?
Mostly not. About 0.19% of the 895,759 bus load readings showed Standing only or Crowded, against 0.22% the week before. The lowest day was the Deepavali holiday on Monday 9 November.
Are the weekly roundups official statistics?
No. They are records of what PantauSivik logged from public data. They are useful for spotting patterns, but they are not official totals.
Sources: PantauSivik's own records of public data, 6 to 12 November 2026, in Singapore time, with comparisons to 30 October to 5 November. Incident alerts are counted once per incident. Expressway times use Land Transport Authority estimates. Charts on the History pages update weekly.
Information in PantauSivik comes from public sources and is there to help you plan. In an emergency, follow official channels. PantauSivik is independent and not affiliated with any government agency.
See also: Week in data, 30 October to 5 November, Week in data, 17 to 29 October, Lightning on 6 November, Which bus interchanges get crowded?, History overview, Public Alerts guide.